Reporting
There is a number of default reports on various parameters available for you. But you can also request custom reports to be created by ShopCtrl. Most reports have a unique authorization item and access to these reports could be granted only to a certain employee role. You can download the report as pdf, Excel, or csv file. Or email it directly from the report window.
You can also set up a scheduled task of sending auto-generated reports via email at a certain time interval with the Mail Scheduler service.
Sales
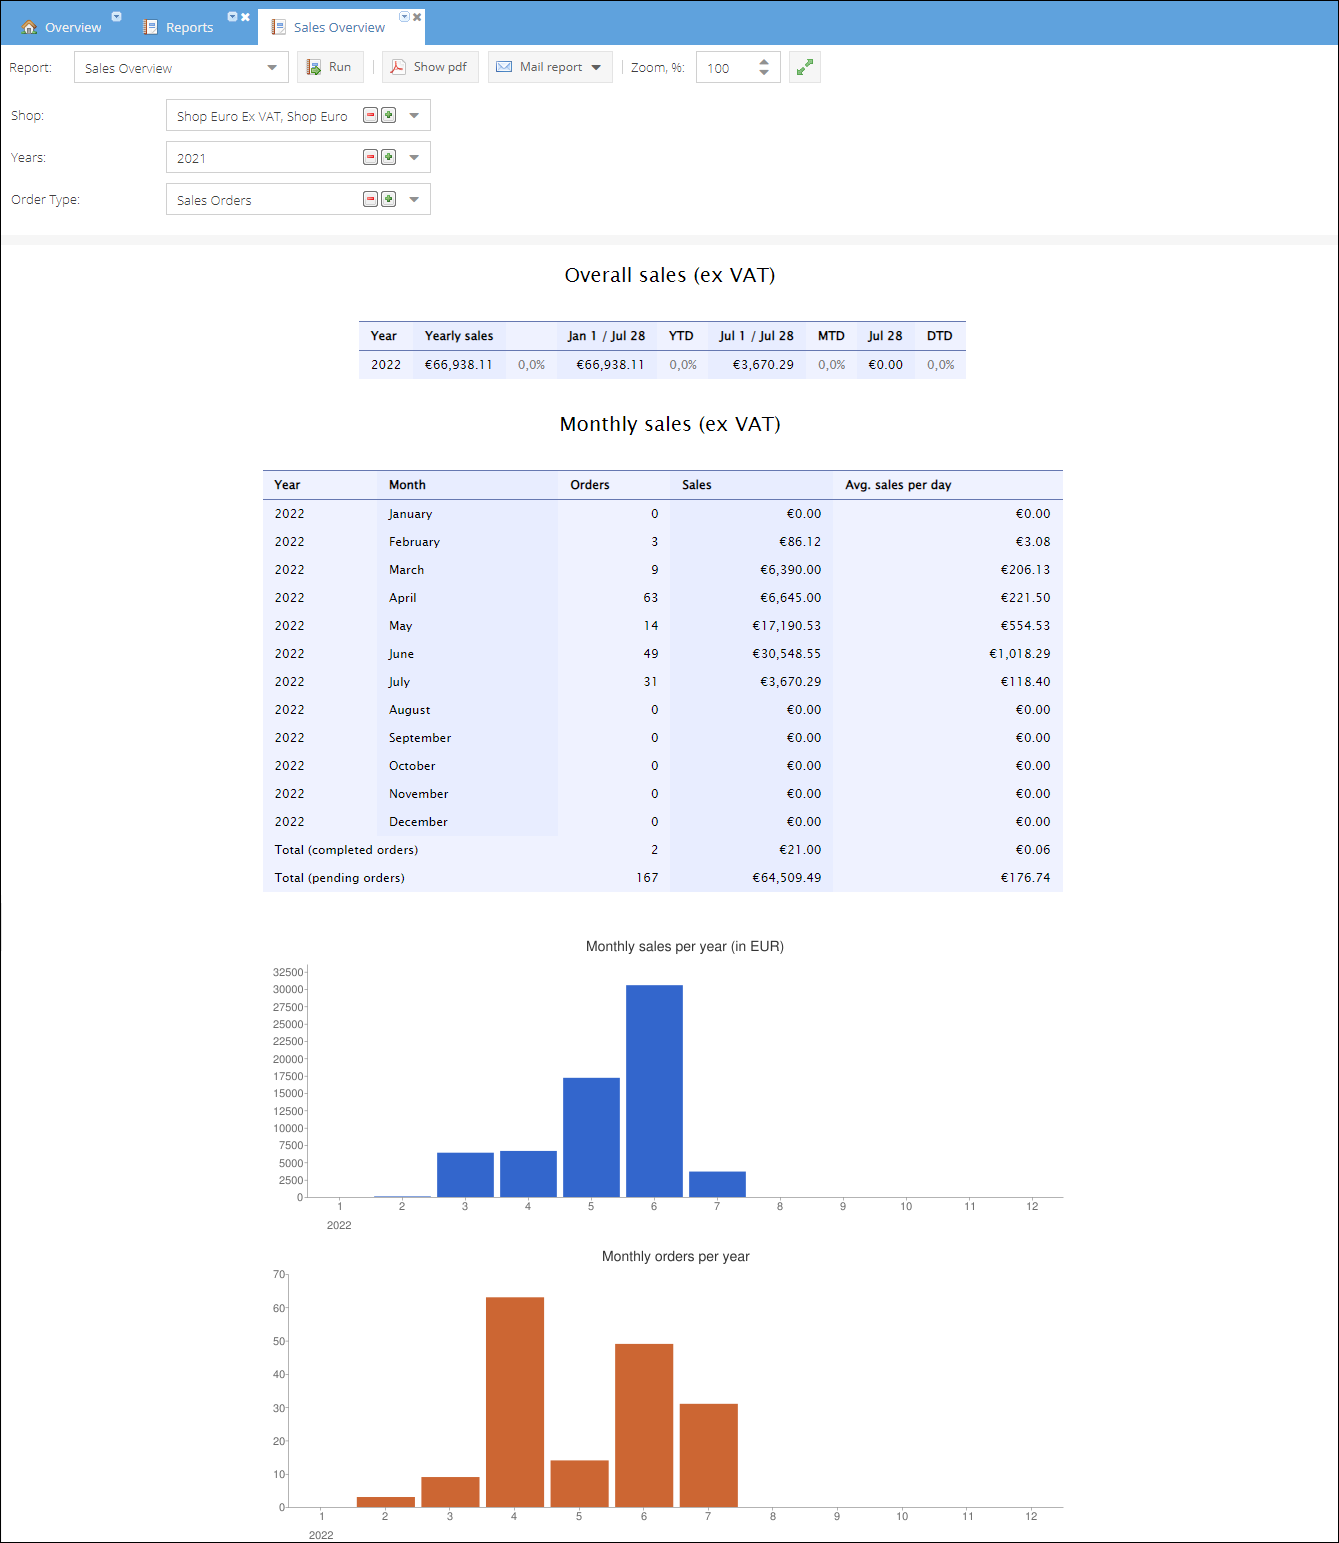
Sales overview report
Sales overview report provides an overview of overall and monthly sales per shop and year specified in a shop owner base currency. Report displays the overall year to date and month to date sales. You can see a total number of orders and sales per month. And average sales per day in a month. The report is visualized with two column charts, which display the dynamics of total sales per month and year(s) and total count of sales per month and year(s).
Report parameters:
- Shops
- Years
- Order type
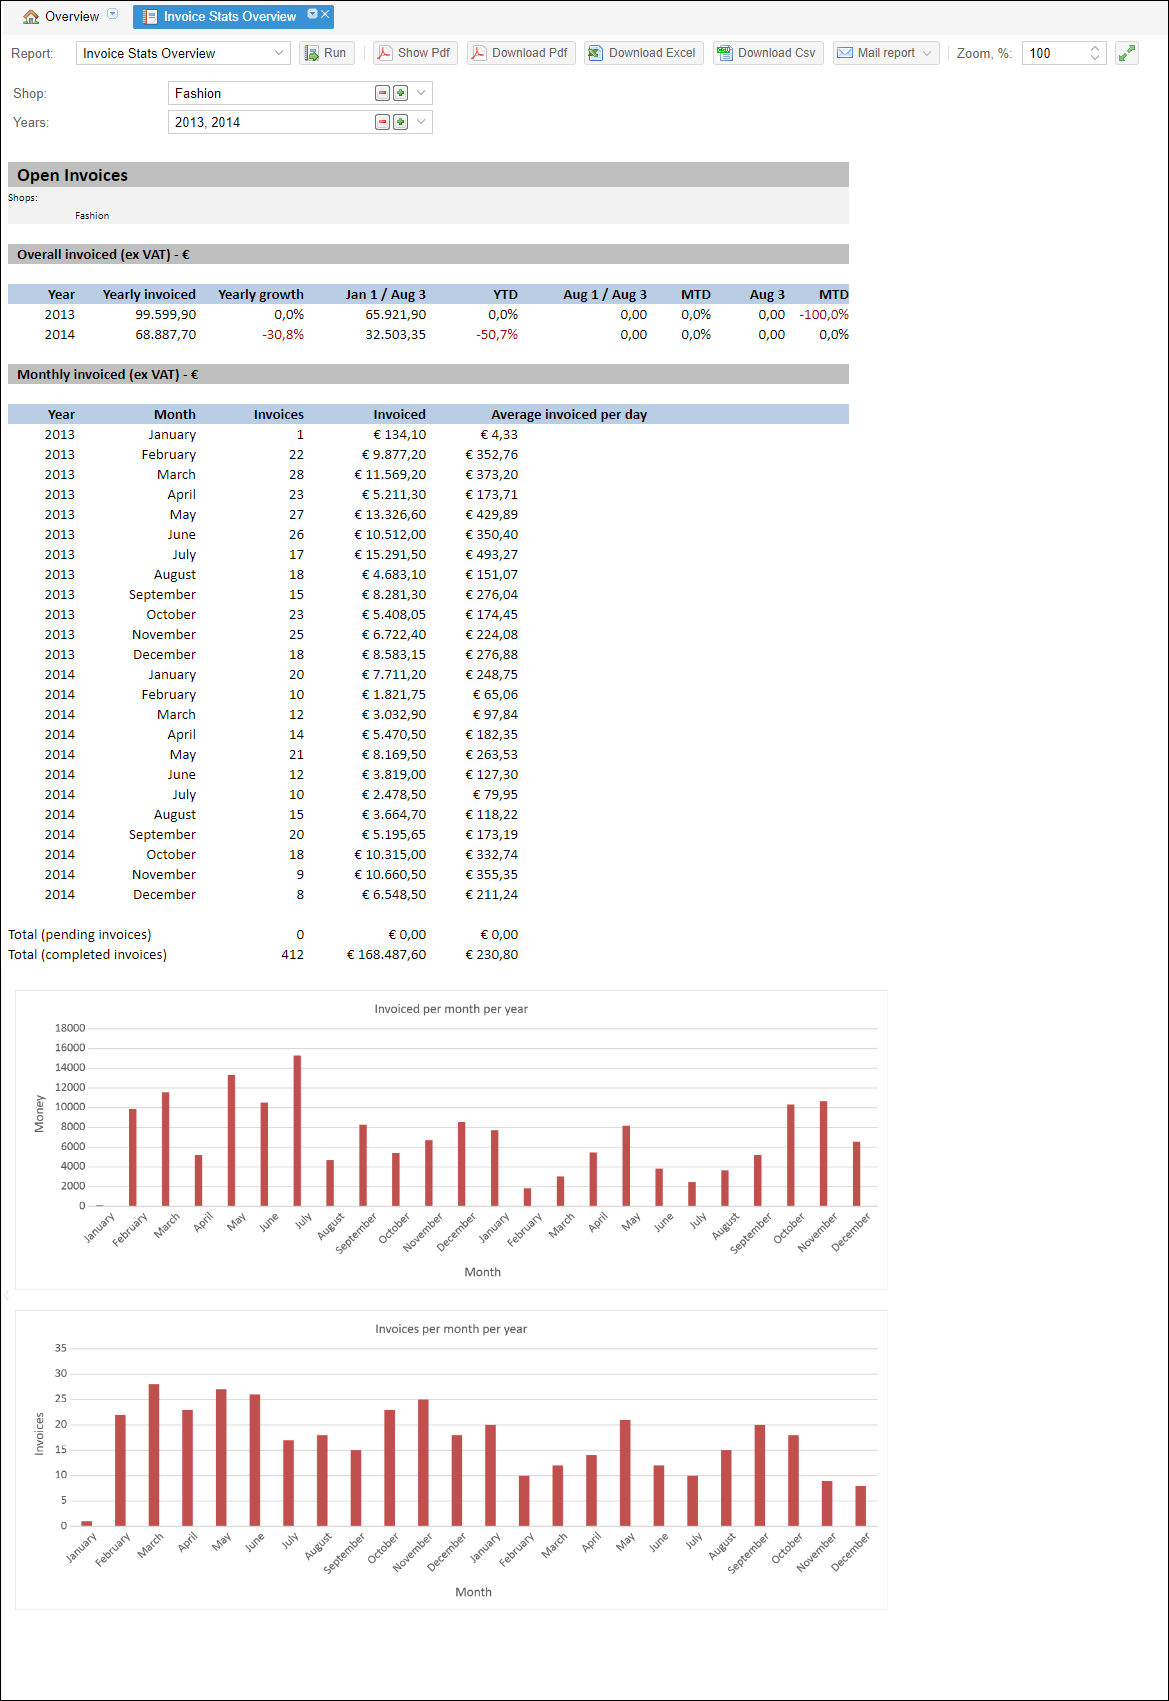
Invoice stats overview report
Report provides a recap of the total invoices issued per month and per year, calculates the overall invoiced year to date and month to date amounts. Totals also give an idea of the pending invoices amounts.
Two charts display the dynamics of total invoiced orders amount per month and year(s) and total count of invoices per month and year(s).
Report parameters:
- Shops
- Years
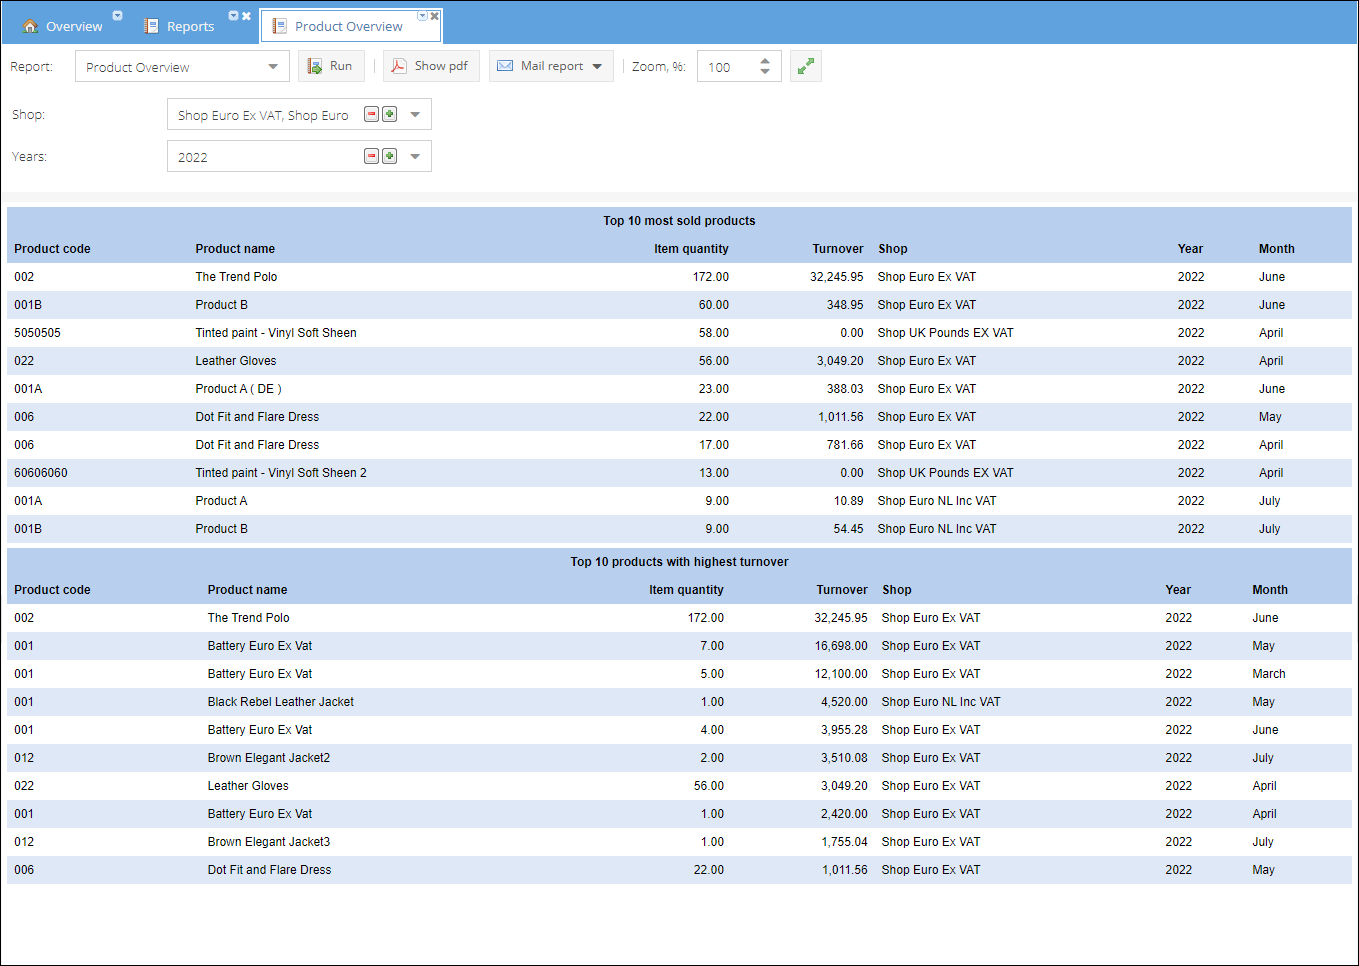
Product overview report
This report shows top 10 most sold products and top 10 products with highest turnover per year.
Report parameters:
- Shop
- Years
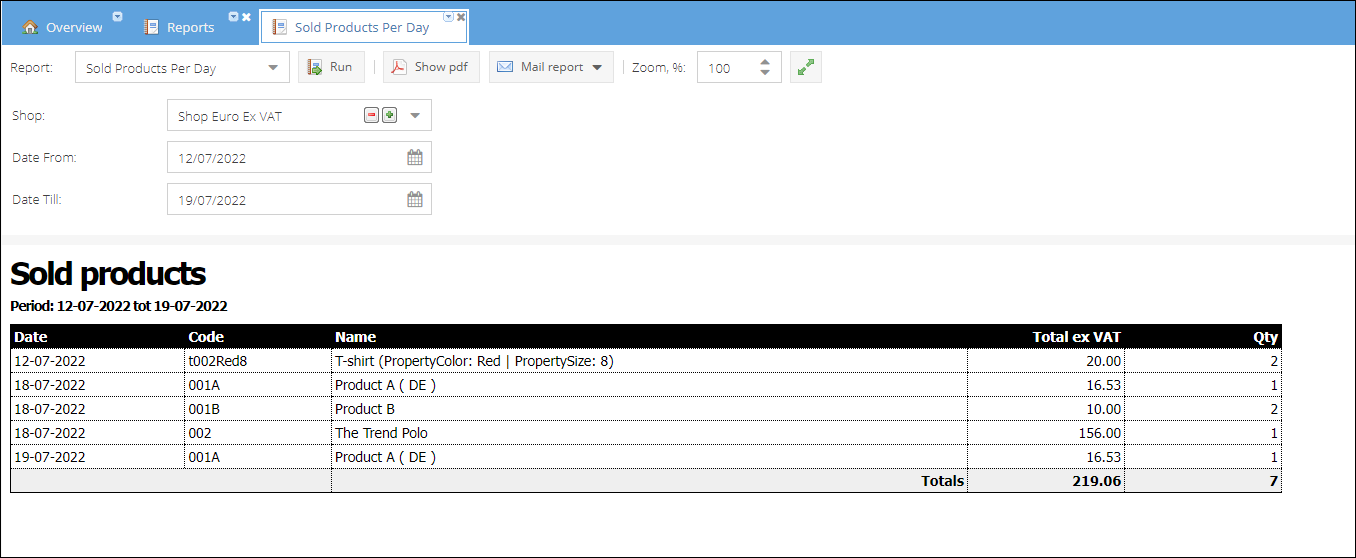
Sold products per day report
A list of products sold per selected shop(s) within defined timeframe. By default, the period is set to 1 day. Changing a timeframe to a bigger period might take a significant amount of time to load data.
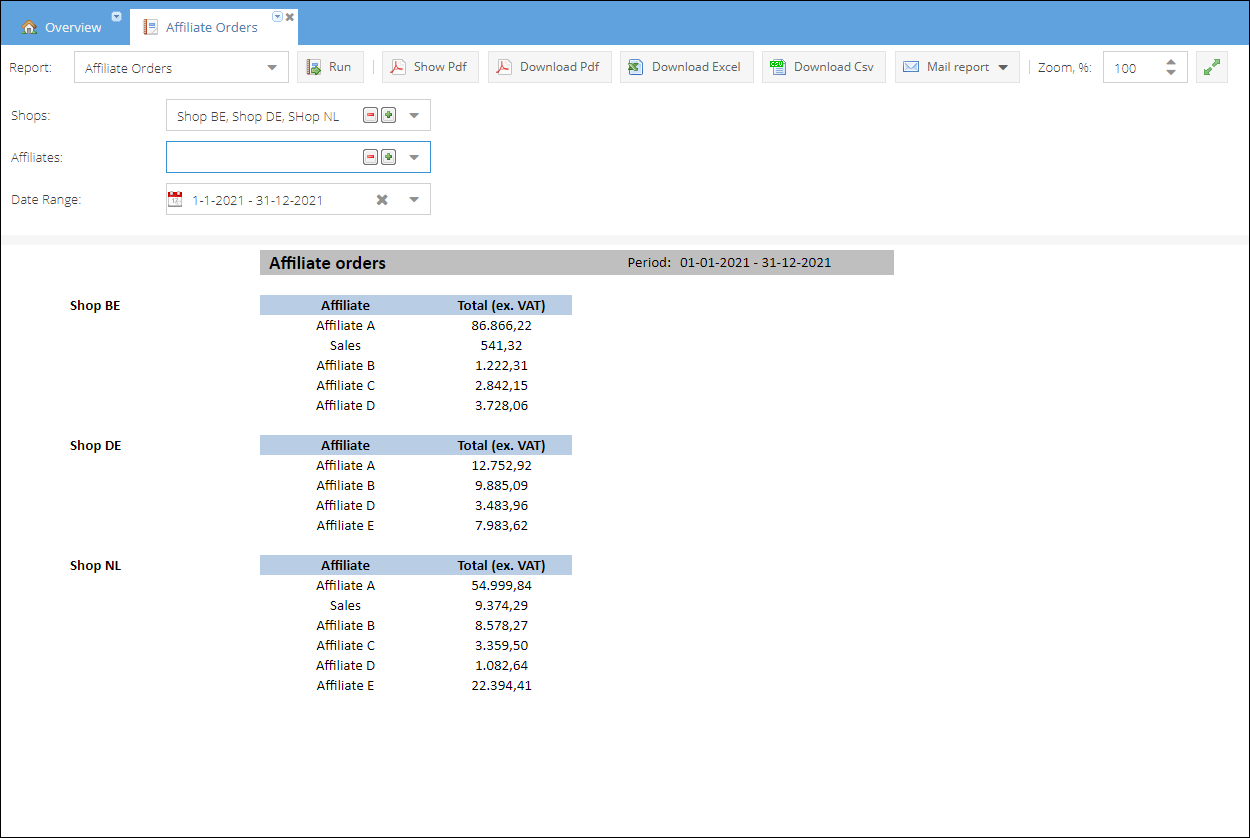
Affiliate orders report
The report displays/calculates total summary in base currency of the orders brought to you by different affiliates.
Report parameters:
- Shops
- Affiliates
- Date Range
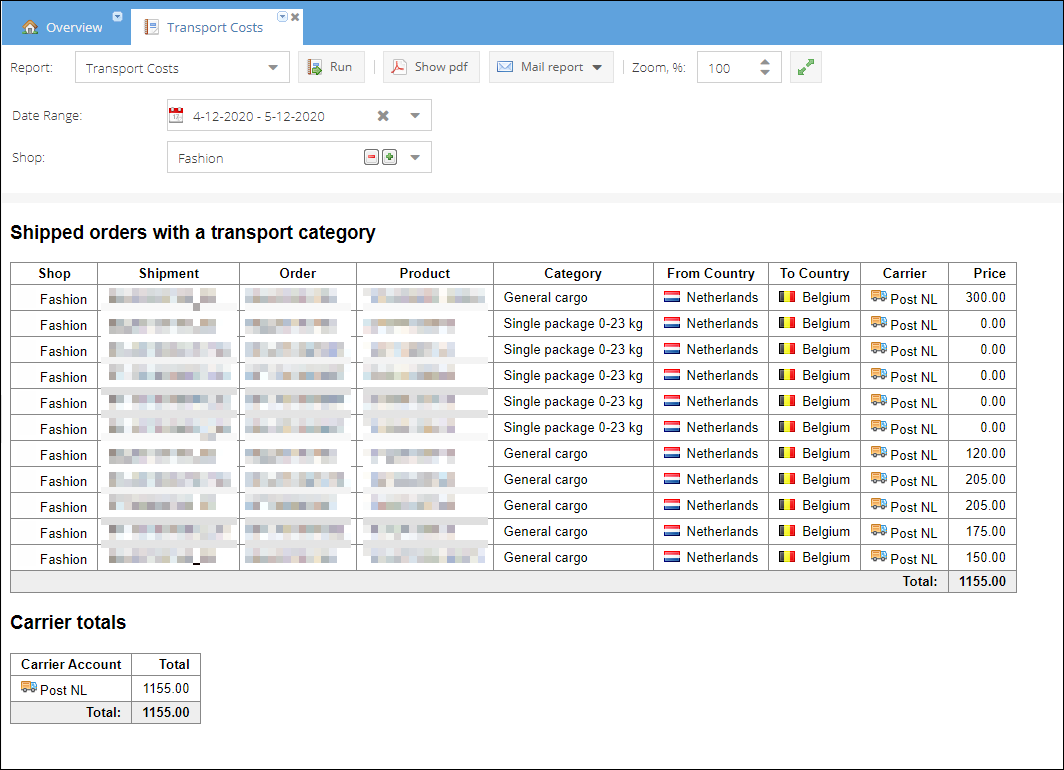
Transport costs
The report groups shipped orders by a transport category and summarizes transport costs per carrier. Report parameters:
- Date Range
- Shop
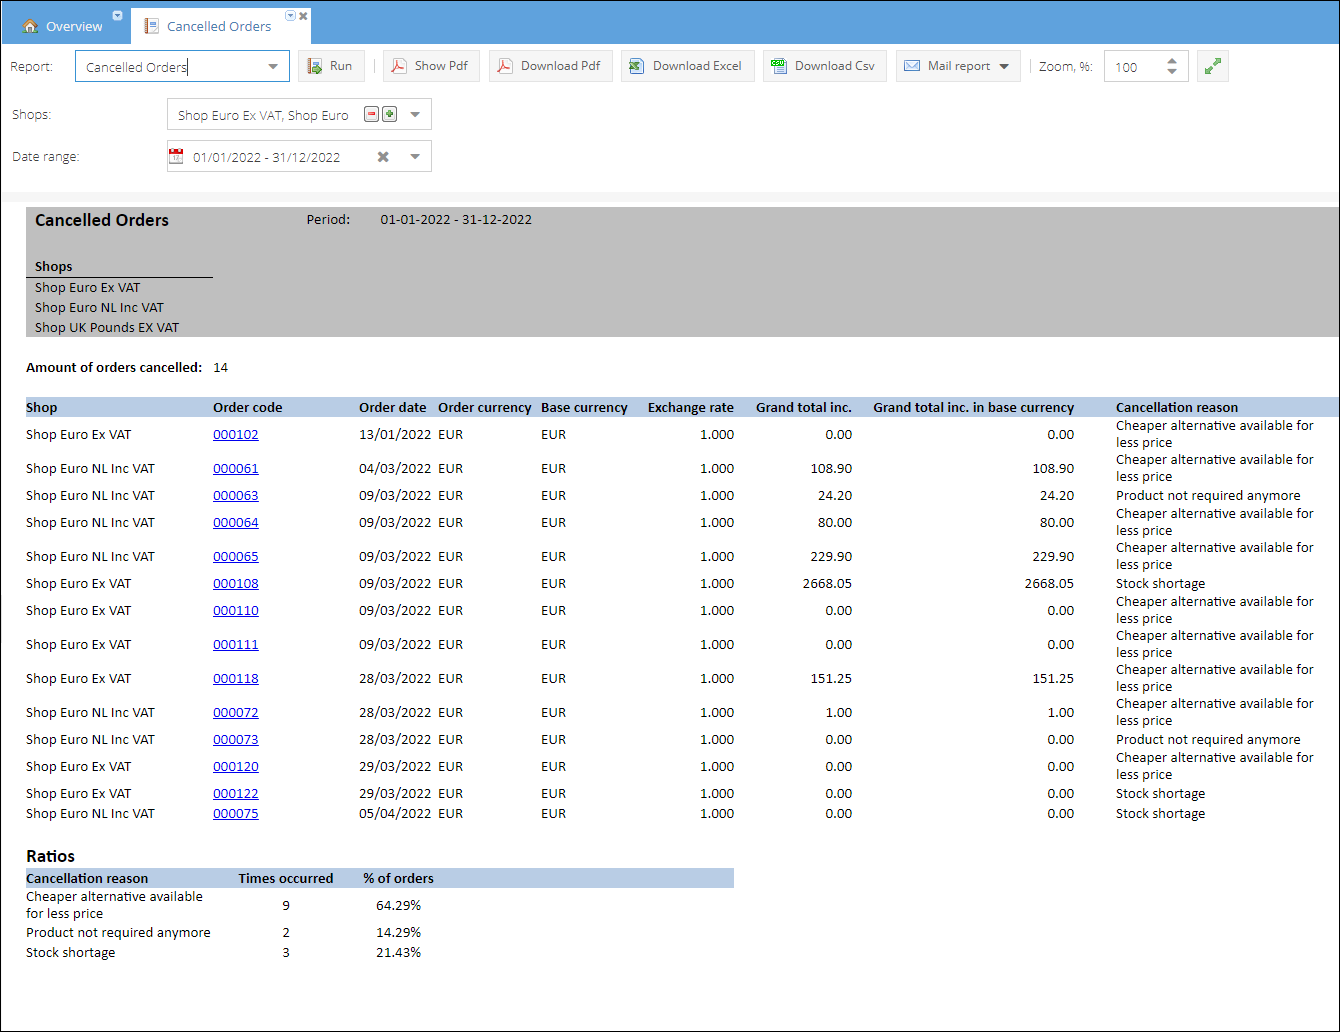
Cancelled orders
The report tracks all cancelled orders for a given shop(s) and period and displays total sum in base currency. The report will also give an overview of the factors that led to a lost sale. The resulting Ratios table shows each cancelation reason and its accompanying percentage.
To create this type of report, create cancel reasons on Configuration-> Statuses > Order cancel reasons page. Add a required step for employees to provide cancel reason when canceling orders on Shop Details page > Order Management tab by enabling Requires a reason on cancelation flag.
Report parameters:
- Shop
- Period
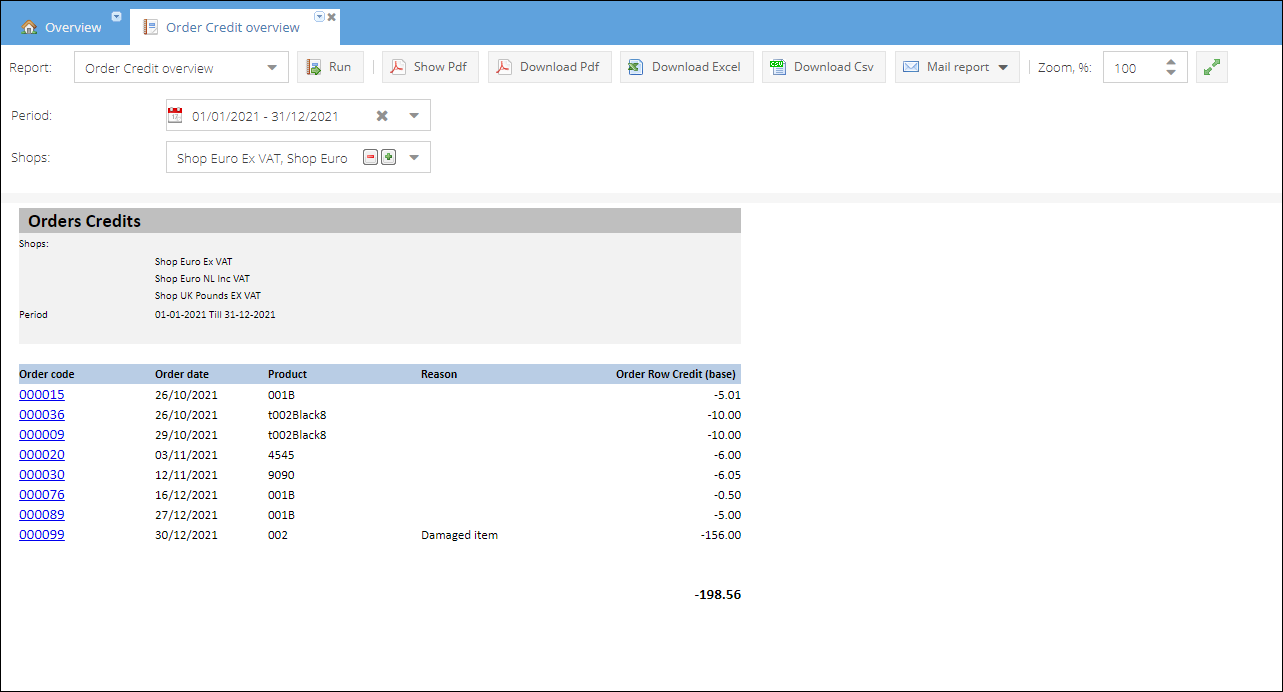
Order credit overview
Order credit overview report prints out a list of credited orders for a given shop(s) and period. Provided that the credit reasons are used while creating returns/refunds, the reasons are also displayed. How to configure return and credit reasons Report parameters:
- Shop
- Period
Service Level Reporting
Service level
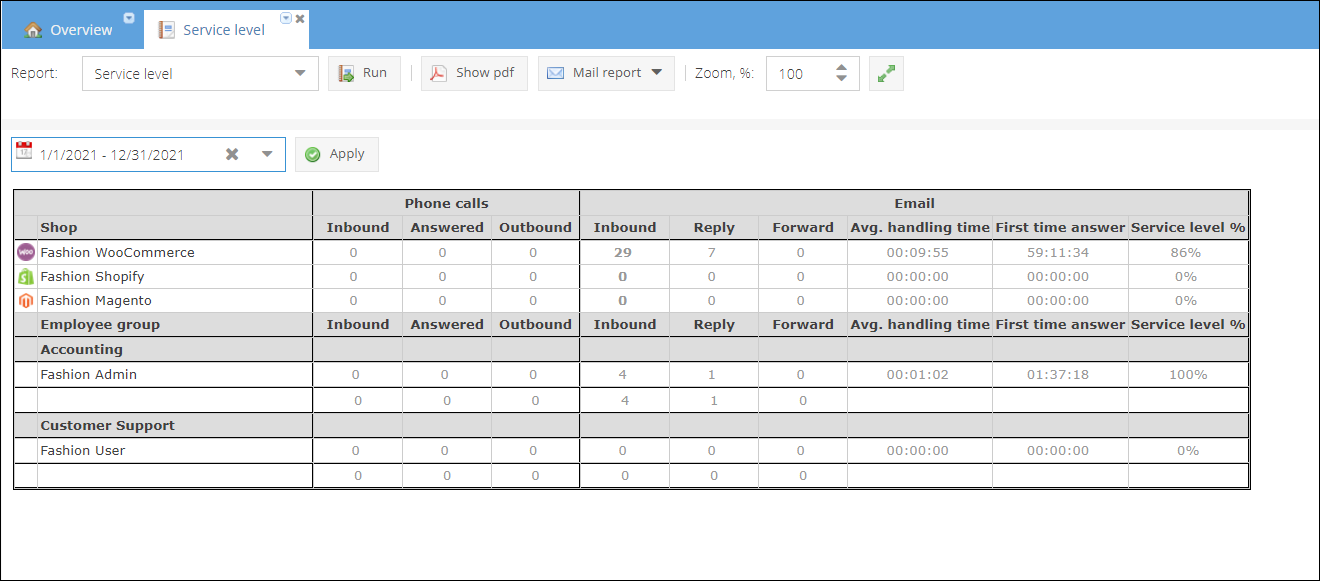
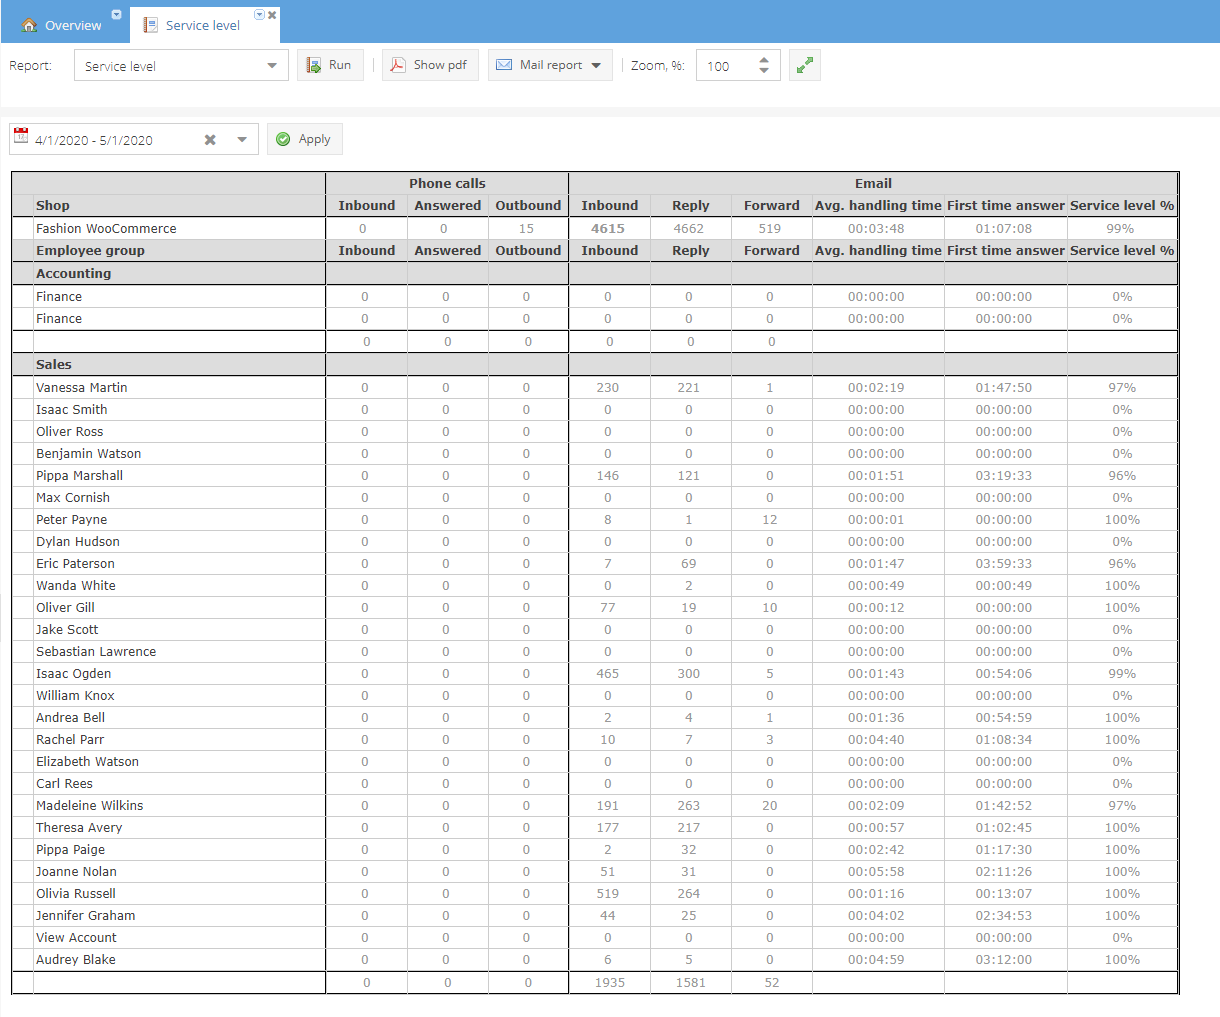
Service level agreement performance data for the selected shops grouped by employees. This report includes the data about the volume of phone calls, email handling time and number of SLA hours it took to achieve the first time answer. The summary service level % column gives information about the percent of inquires handled by an employee within SLA hours.
The SLA response time is configured on a shop level. Please check Service Level for more information.
Report parameters:
- Shop (selection of shops in sales channel pane)
- Date range
Ticket statistics
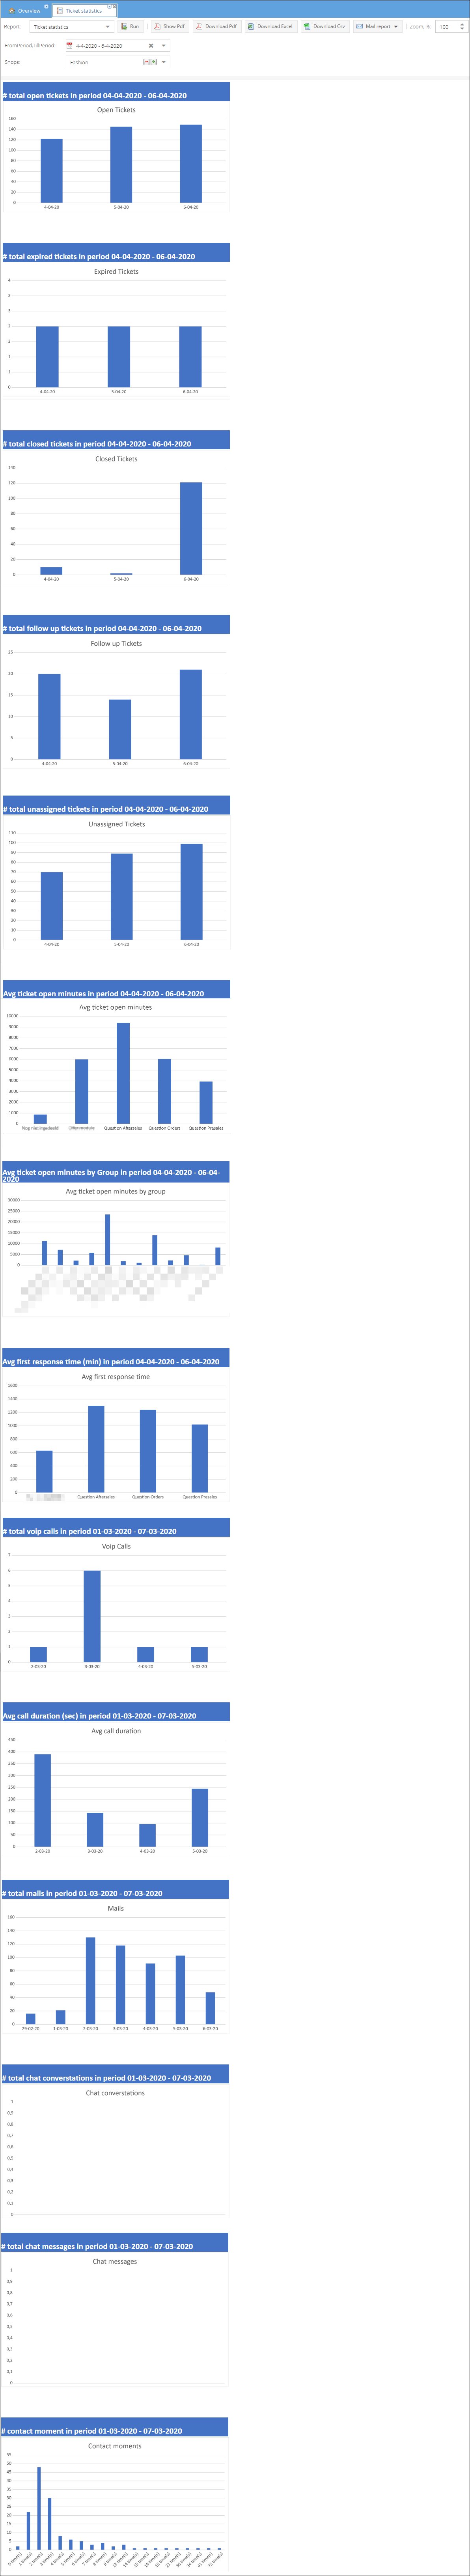
Report consists of 13 charts on ticket statistics.
| Chart | Description |
|---|---|
| Open tickets | Total open tickets chart in the specified date range for the selected shop(s) |
| Expired tickets | Total expired tickets chart in the specified date range for the selected shop(s) |
| Closed tickets | Total closed tickets chart in the specified date range for the selected shop(s) |
| Follow-up tickets | Total tickets marked as follow-up per day in the specified date range for the selected shop(s) |
| Unassigned tickets | Total count of unassigned tickets per day for the selected shop(s) |
| Avg ticket open minutes | Average time in minutes tickets spent in open state per category |
| Avg ticket open minutes by group | Average time in minutes tickets spent in open state per employee group |
| Avg first response time | Average time in minutes till first response grouped by category |
| VoIP calls | Number of VoIP calls per day in a period |
| Avg call duration | Average calls duration per day in period |
| Mails | Total emails exchanged per day in period |
| Chat conversations | Total chat conversations per day in period |
| Chat messages | Total chat messages per day in period |
| Contact moments | Contact time distribution |
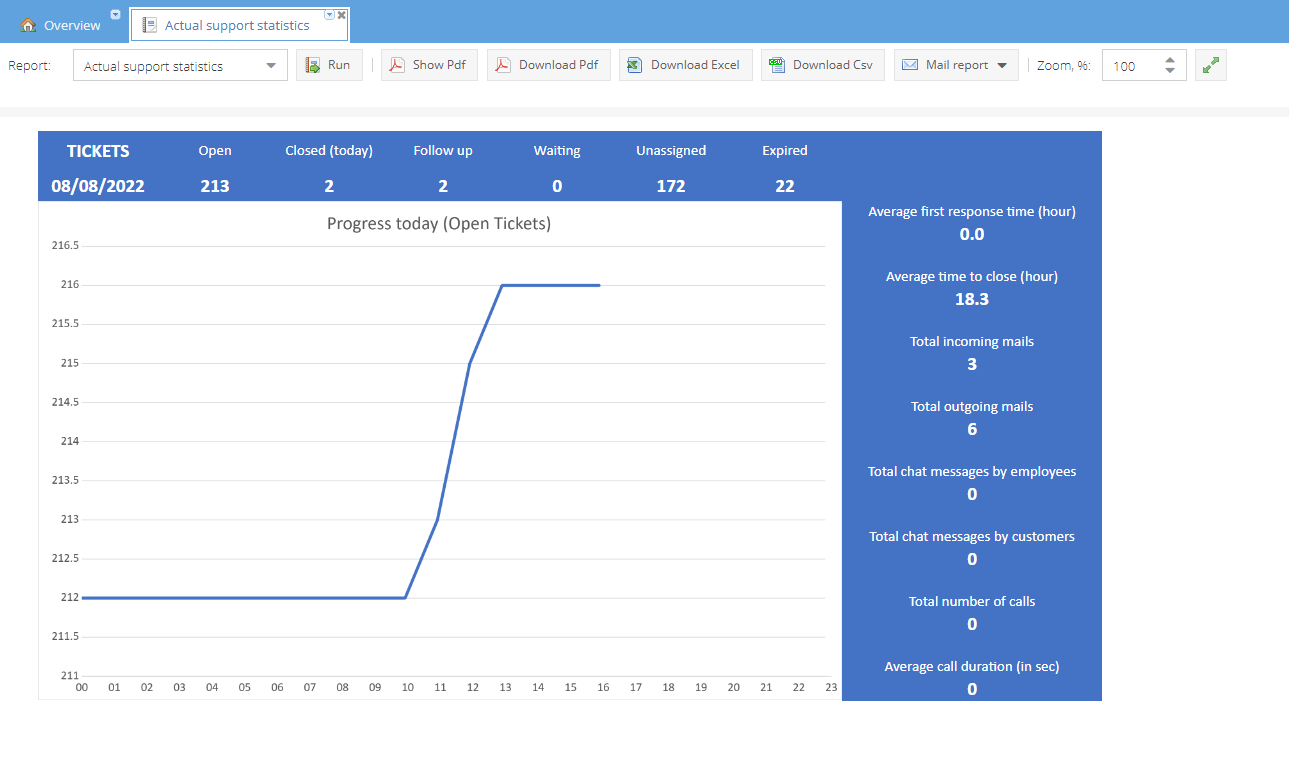
Actual support statistics
Actual support statistics provide a snapshot of the day with the current support progress. Report accumulates tickets data and chat and VoIP calls requests initiated by both employees and customers. The chart shows the increase in open tickets for the current day.
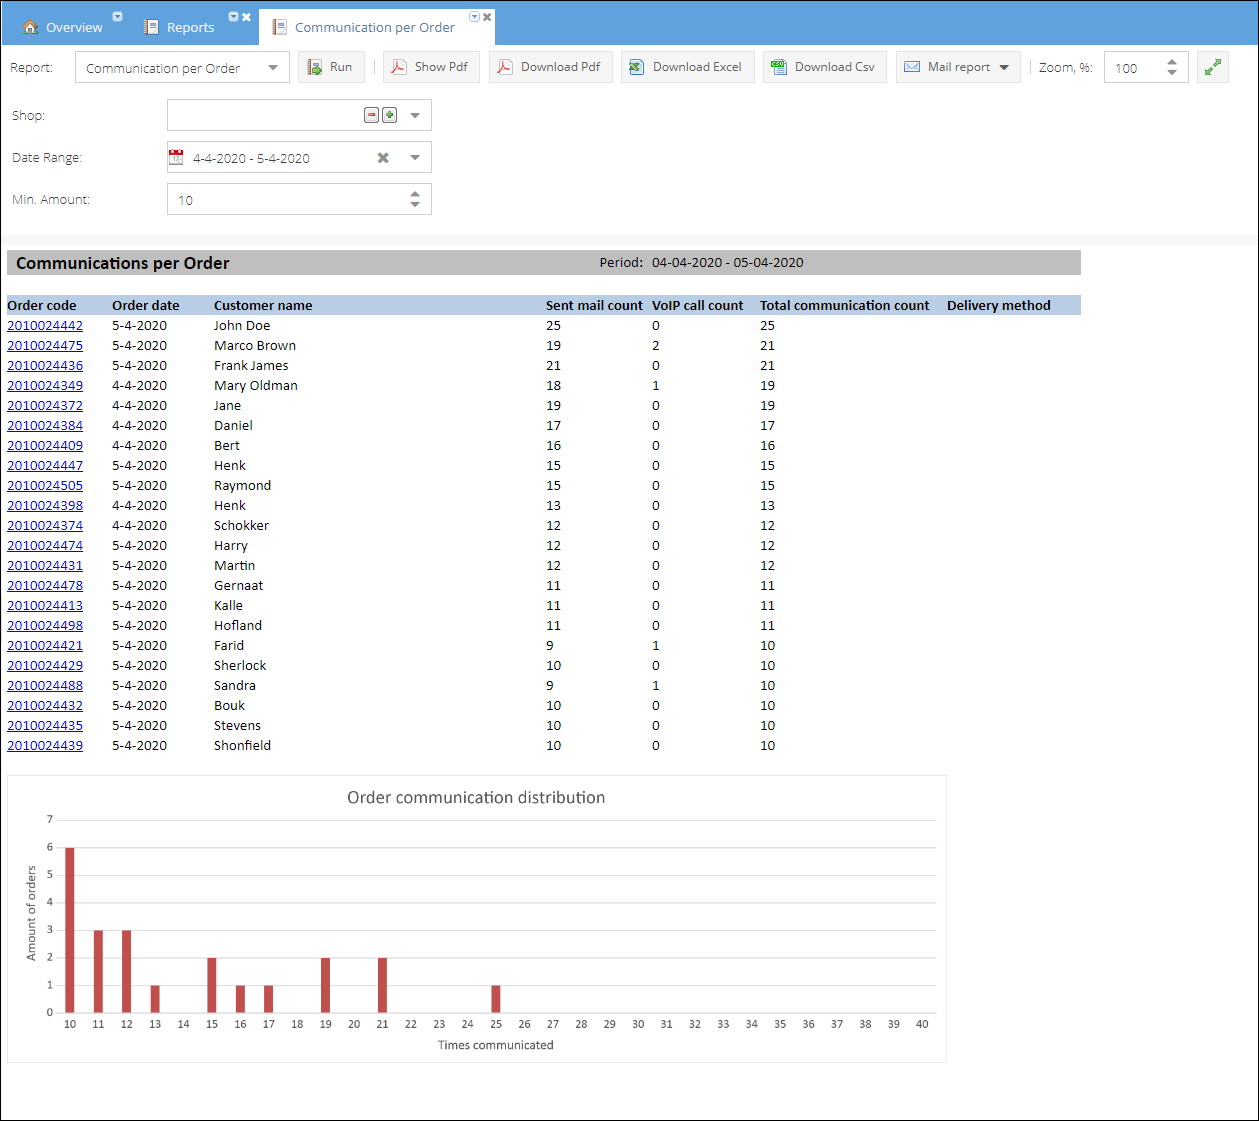
Communication per Order
A list of orders of a certain shop within the selected timeframe with minimum communication count higher than the specified minimum amount. The most frequently occurring communication counts per order are visualized with the Order communication distribution chart.
Report parameters:
- Shop
- Date range
- Min. Amount - minimum amount of total communication count per order
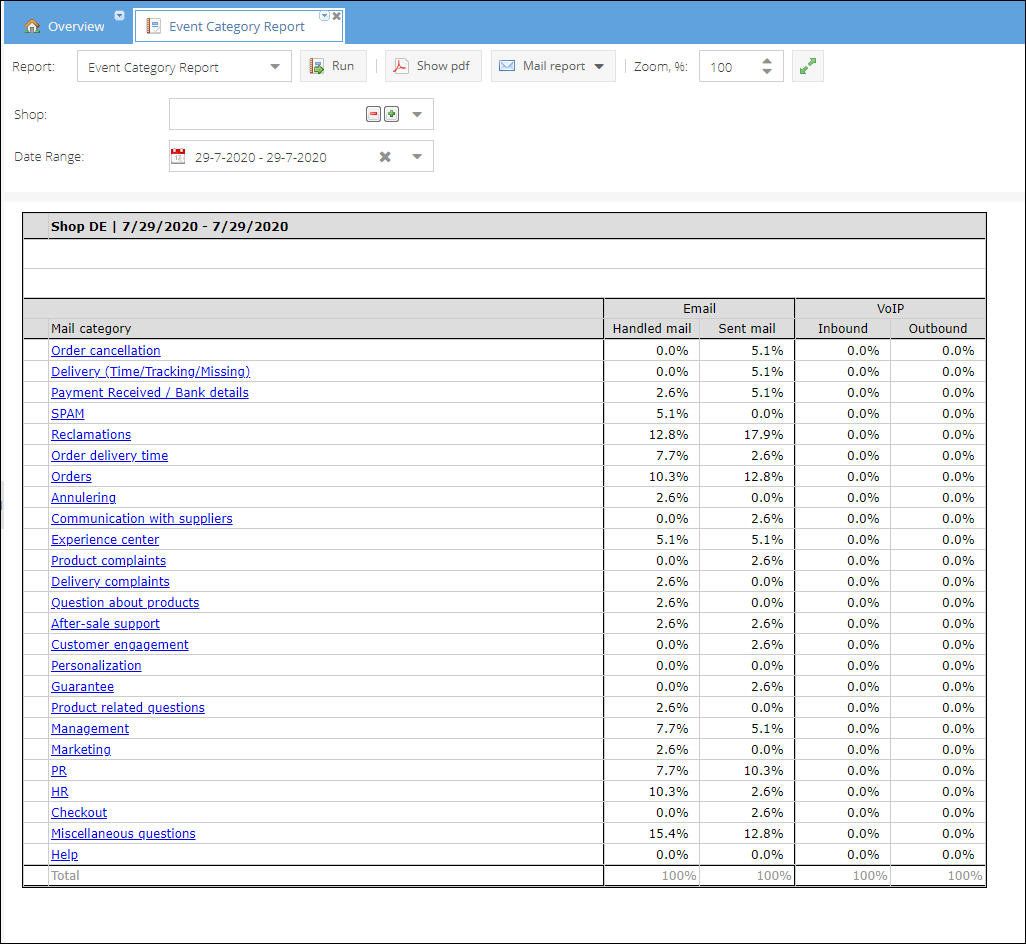
Event category report
Report groups communication events like emails and VoIP calls per mail category over all shops selected.
Report parameters:
- Shop
- Date range
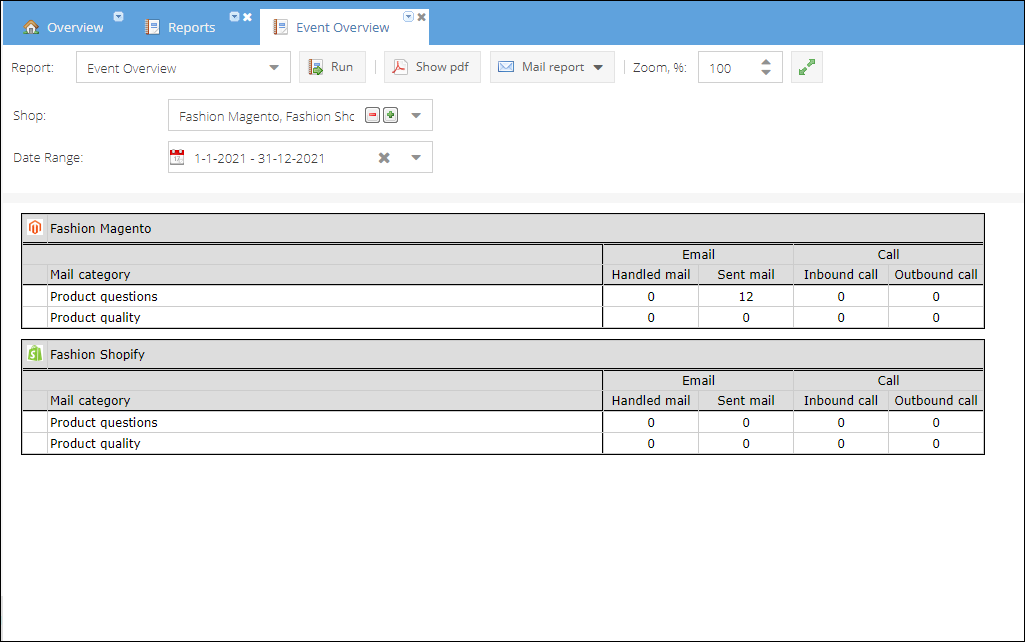
Event overview report
Report groups communication events like emails and VoIP calls per shop and per category over a chosen period.
Report parameters:
- Shop
- Date range
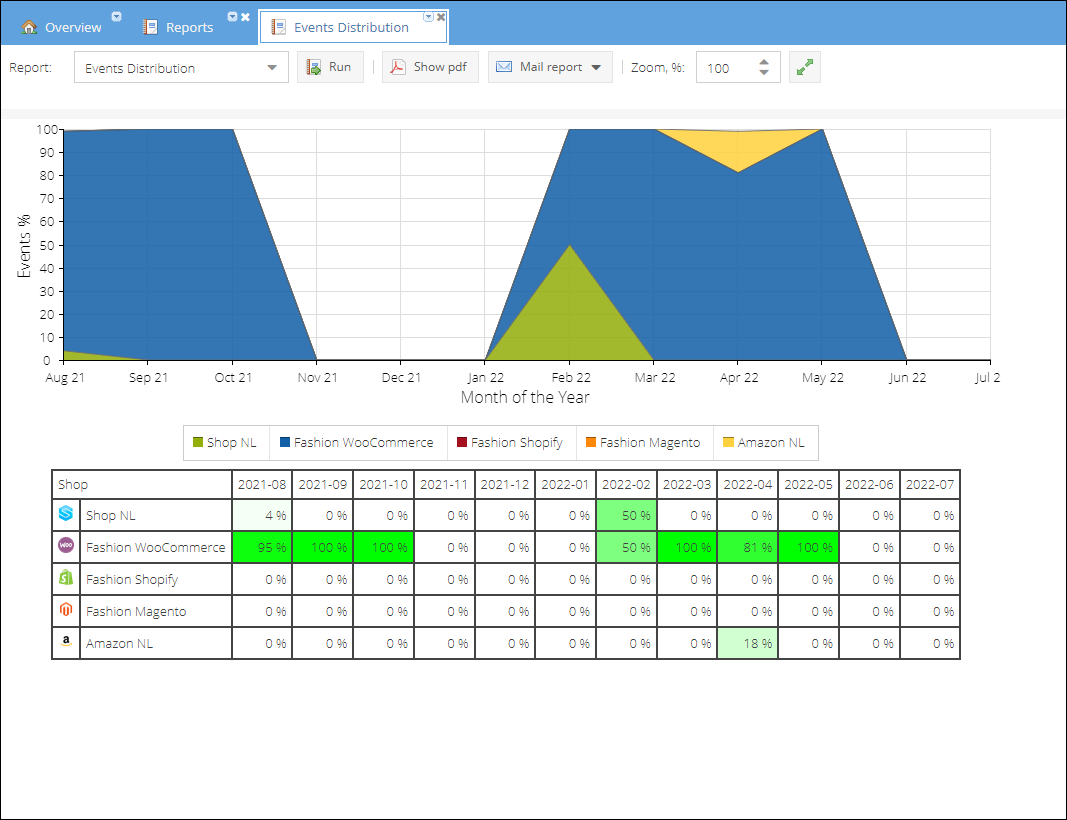
Events distribution report
Event distribution report contains an area chart displaying events distribution per shop over a year period. The most busy months are highlighted in green.
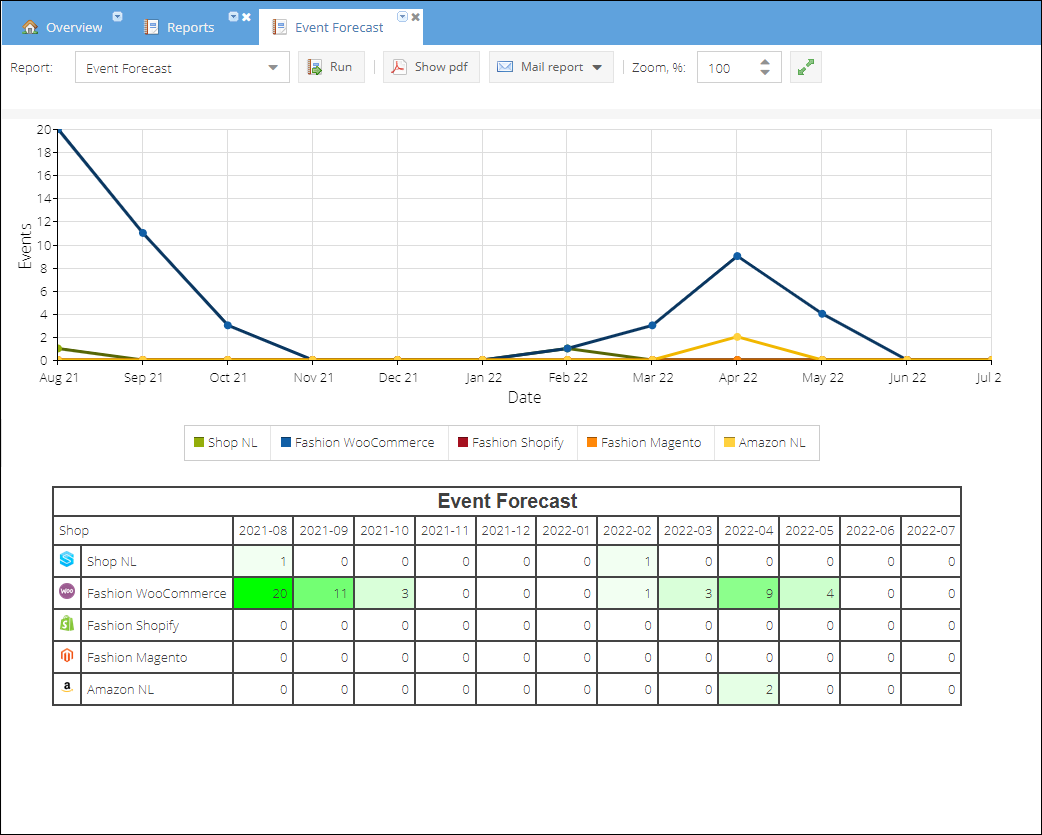
Event forecast report
Event Forecast Report contains a line chart with the total number of events over a year period grouped by shop and month.
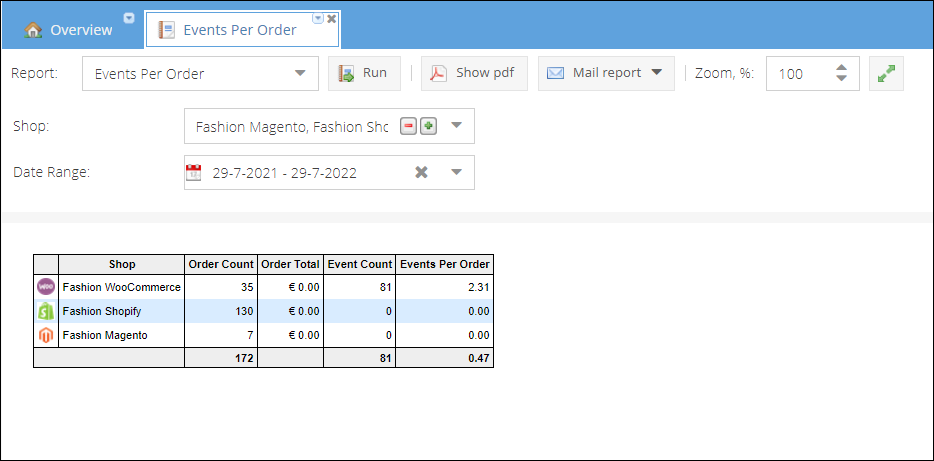
Events per order report
Report contains the summary of all events, like VoIP calls and emails and calculates the average events per order ratio.
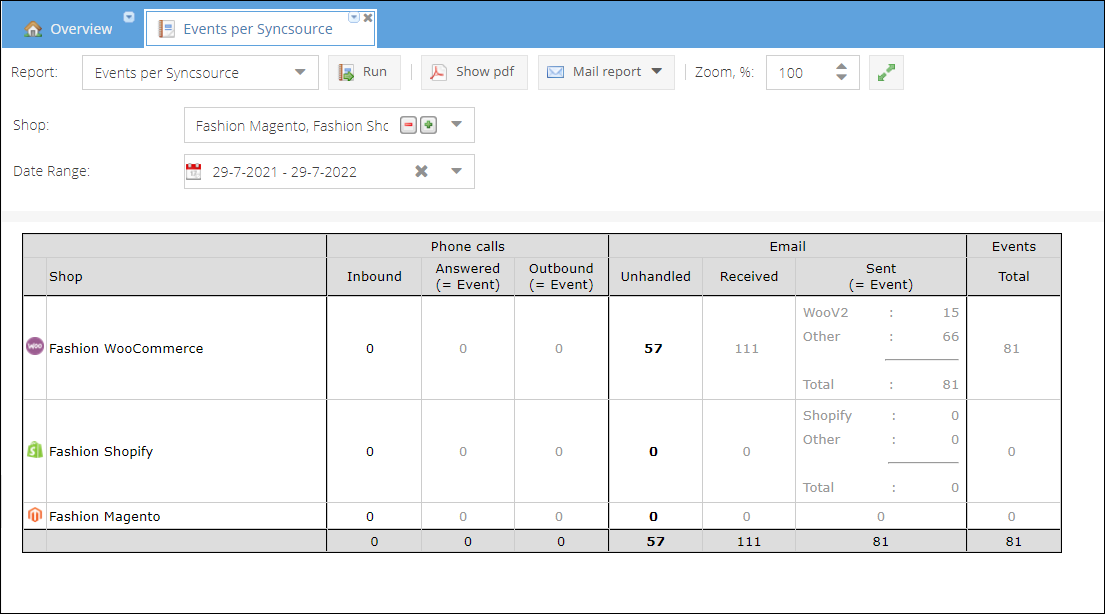
Events per sync source
Events per synchronization source report gives an overview of the events that came through synchronization channels.
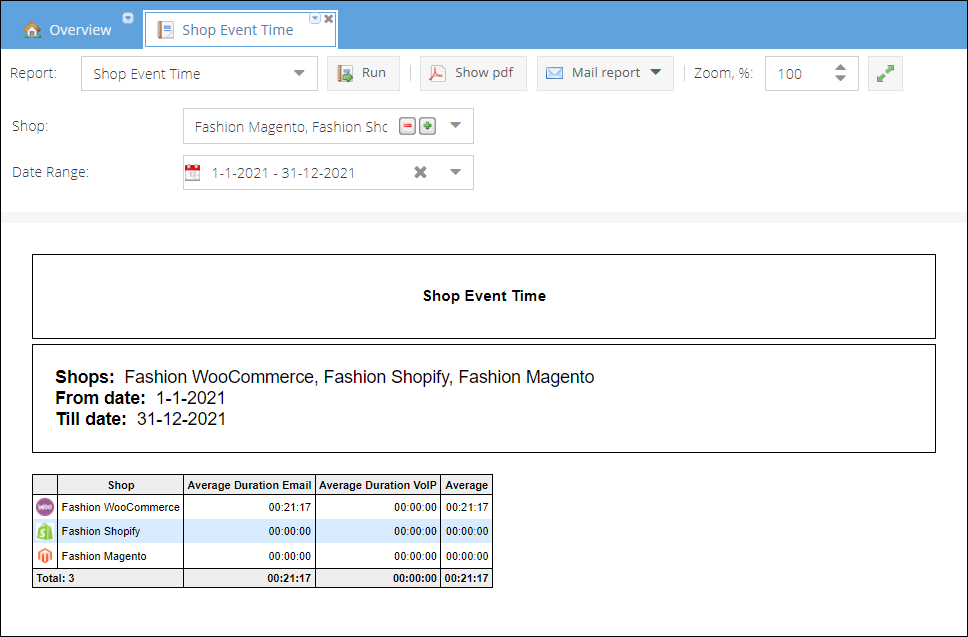
Shop event time
The Shop event time report calculates for a shop(s) average duration of VoIP calls and time spent on mail creation for a specified period. Report parameters:
- Shop
- Date range
Employee performance and activities
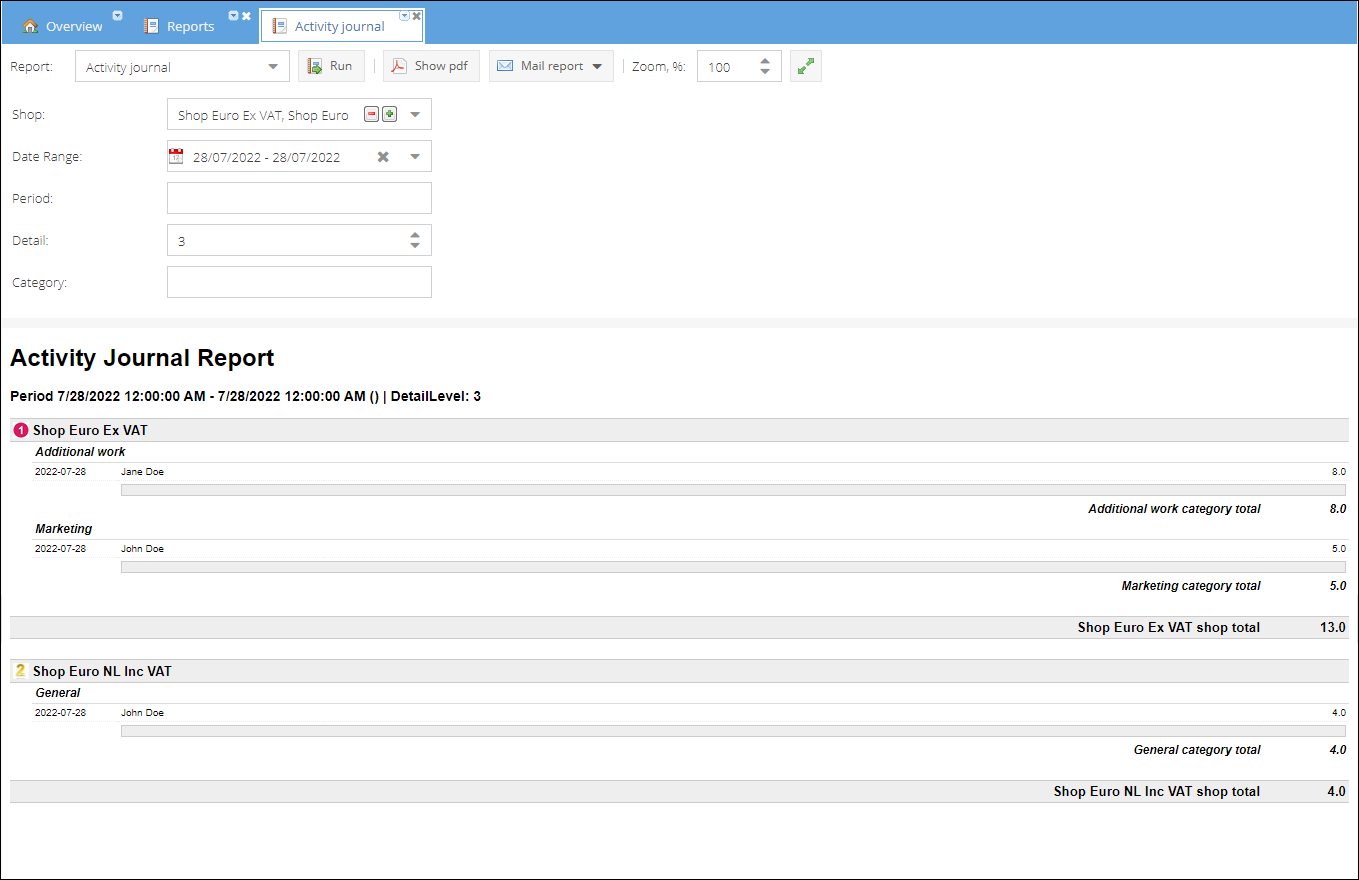
Activity journal report
Report summarizes hours spent on different activities by employees for a given period. Activities are registered and tracked on the General > Activities tab. You can specify either date range or period, level of detail, and a category for which you would like to get a detailed report.
Report parameters:
- Shop
- Date range or period
- Level of detail
- Category
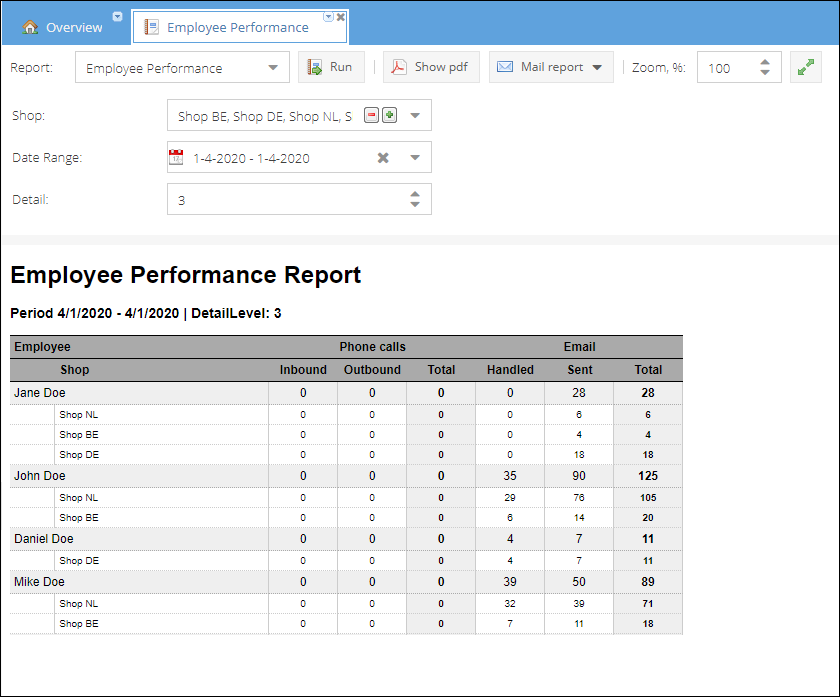
Employee performance report
Employee performance report provides data about total handled phone calls and emails grouped by employee and shop(s).
Report parameters:
- Shop
- Date Range
- Detail (default 3)
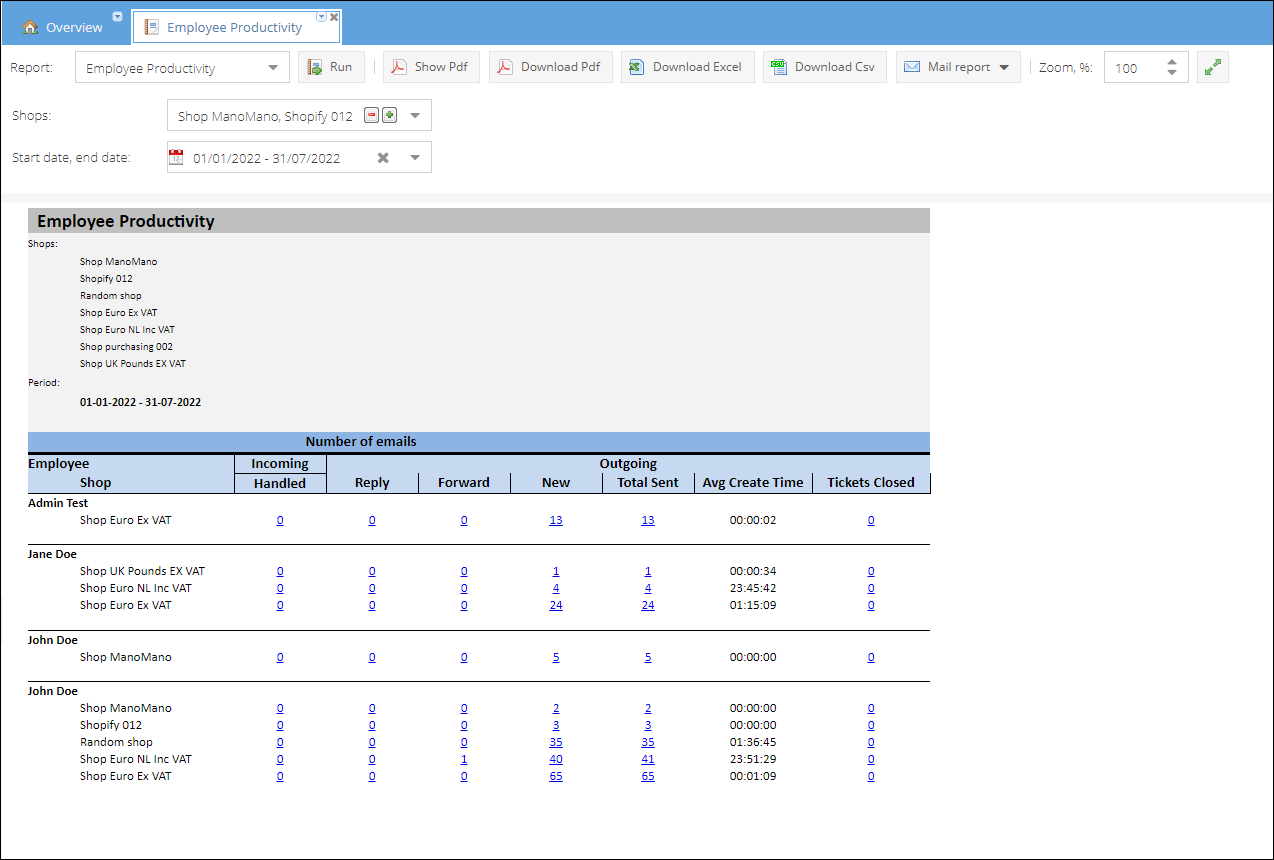
Employee productivity report
Employee productivity report displays the most detailed overview of the communication happening via email per employee. Report is grouped by employee and provides details of the emails sent and connected tickets closed.
The list of the emails exchanged is provided with a number of sub-reports. To open either of sub-reports, click the corresponding email count in the report:
- Forwarded Mail
- Handled Mail
- New Mail
- Reply Mail
- Tickets Closed Detail
- Total Mail Sent
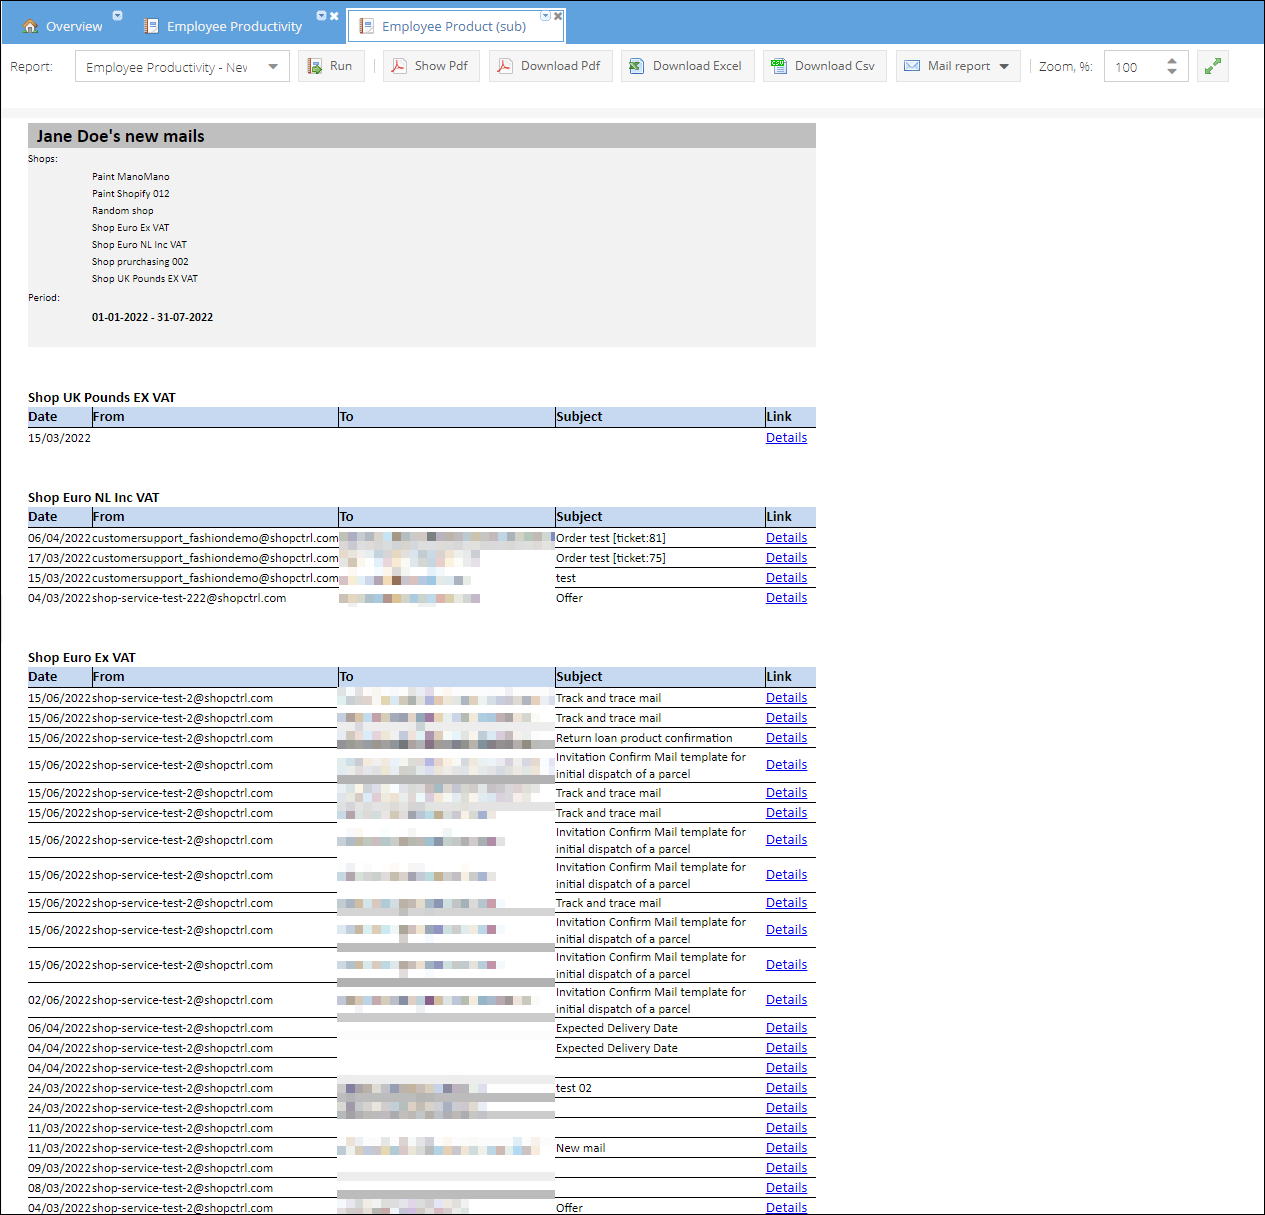
Sub-report: New emails sent by employee.
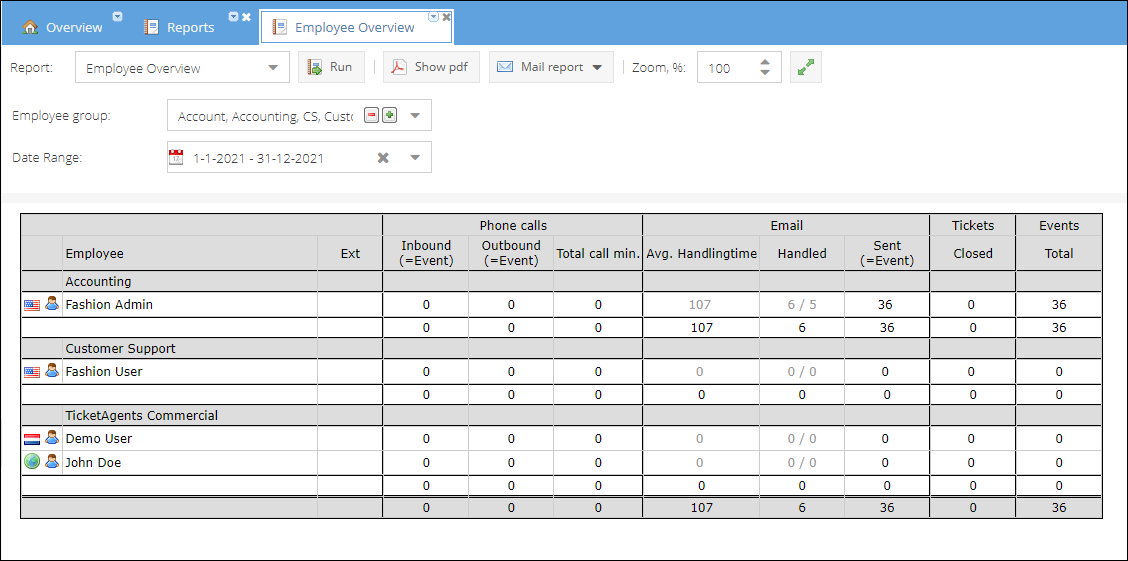
Employee overview report
This report displays a recap of events handled by employees with detailed data about phone calls duration and email handling time. It also summarizes the number of closed tickets per employee. Report data is grouped by employee group. If an employee belongs to several groups, their data is added to each group's total.
Report parameters:
- Employee group
- Date Range
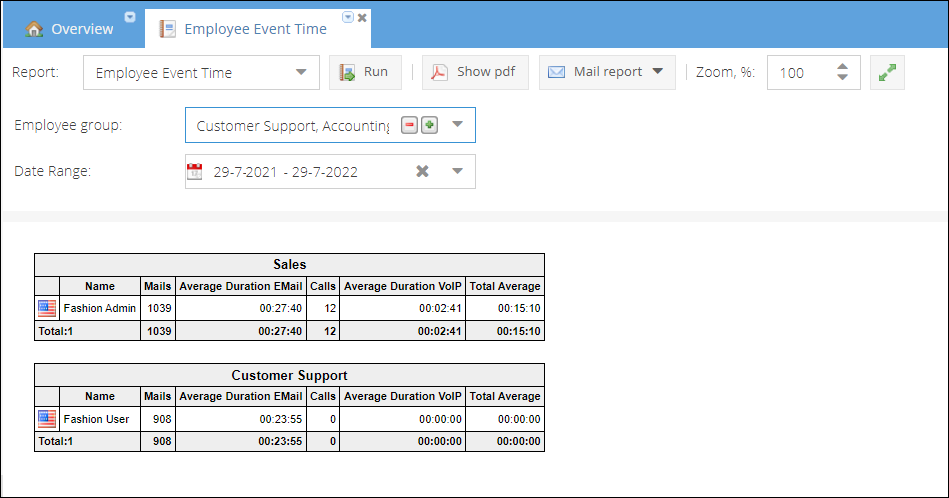
Employee event time
Employee event time report gives statistics about the total number of events (VoIp calls and emails) handled by employees within the selected timeframe. It also calculates the average time spent handling emails and answering calls.
Report parameters:
- Employee group
- Date Range
Reports on communication statistics
Phone - VoIP
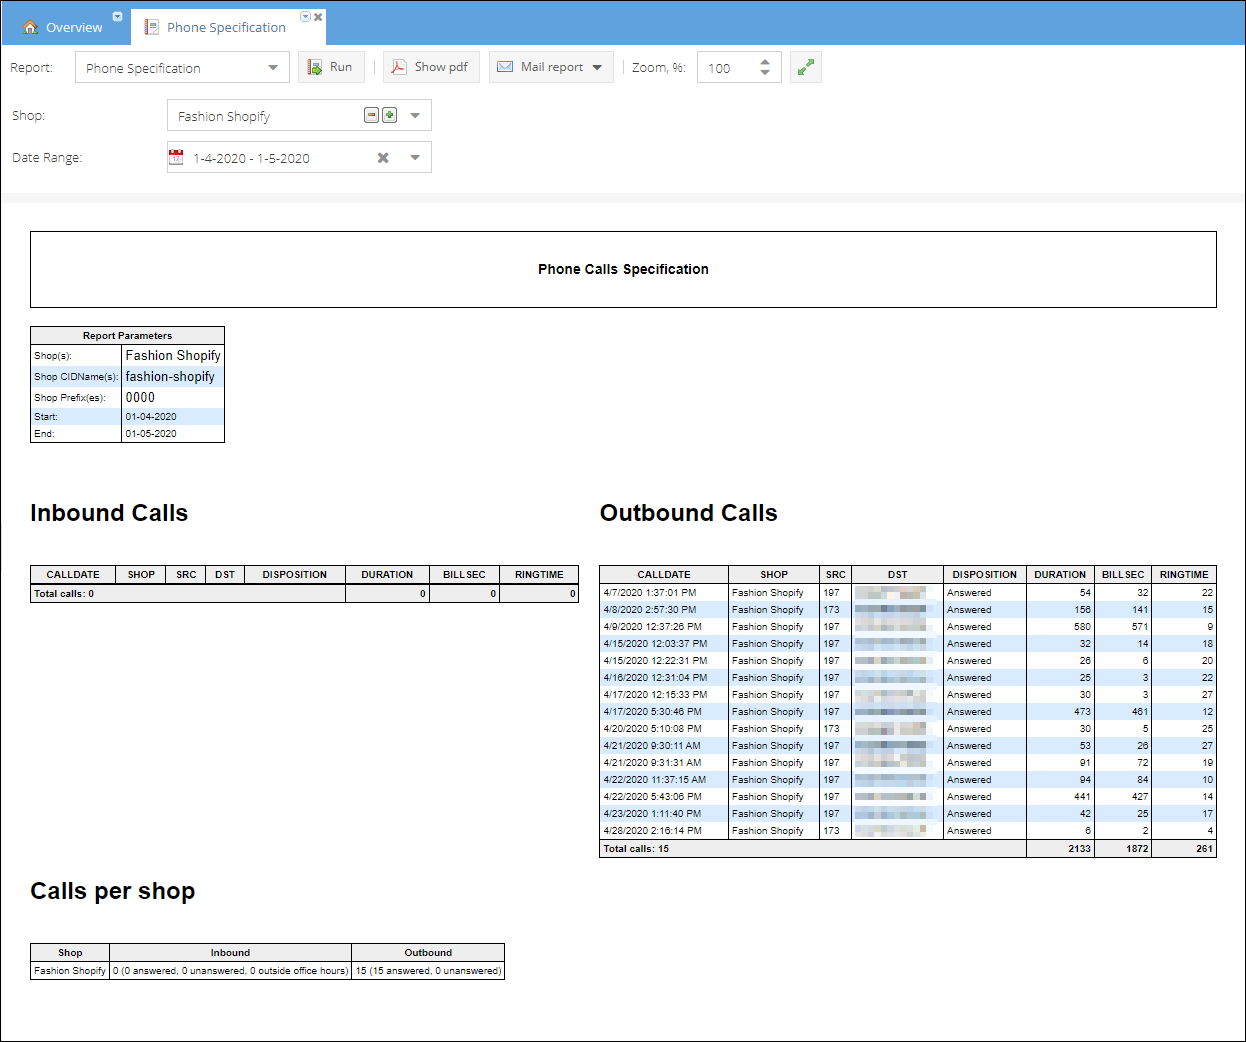
Phone calls specification
Detailed report of received and answered calls. Includes in-depth call details, like call duration and destination phone numbers. Report parameters:
- Shop
- Date Range Or Period
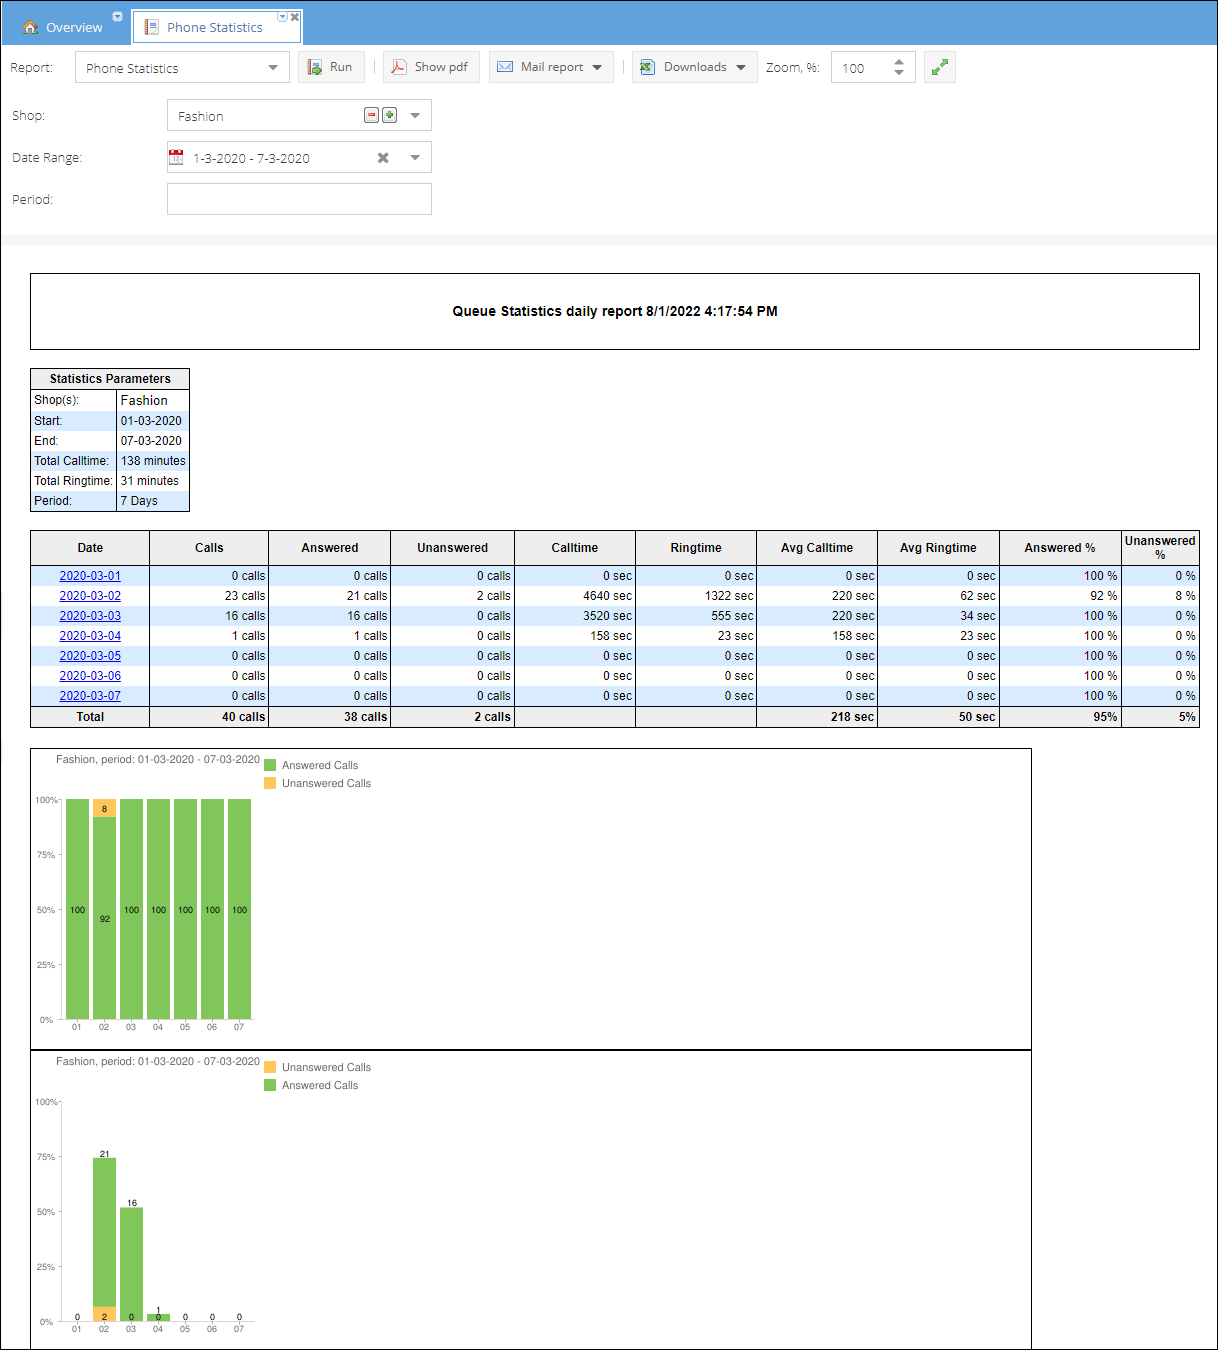
Phone statistics
Queue statistics daily report. Provides data about the % of unanswered calls with two graphs visualizing the ratio of lost calls. By default period is set to the current month.
Report parameters:
- Shop
- Date Range Or Period
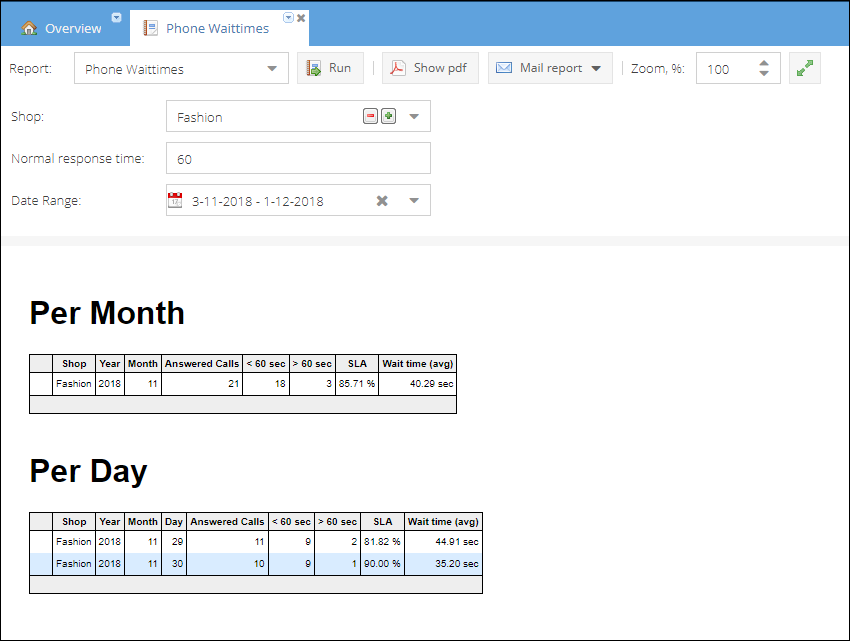
Phone wait times
Report compares wait time of answered phone calls against predefined normal response time.
Report parameters:
- Shop
- Normal response time defined in seconds
- Date Range
Reports on Wiki item usage
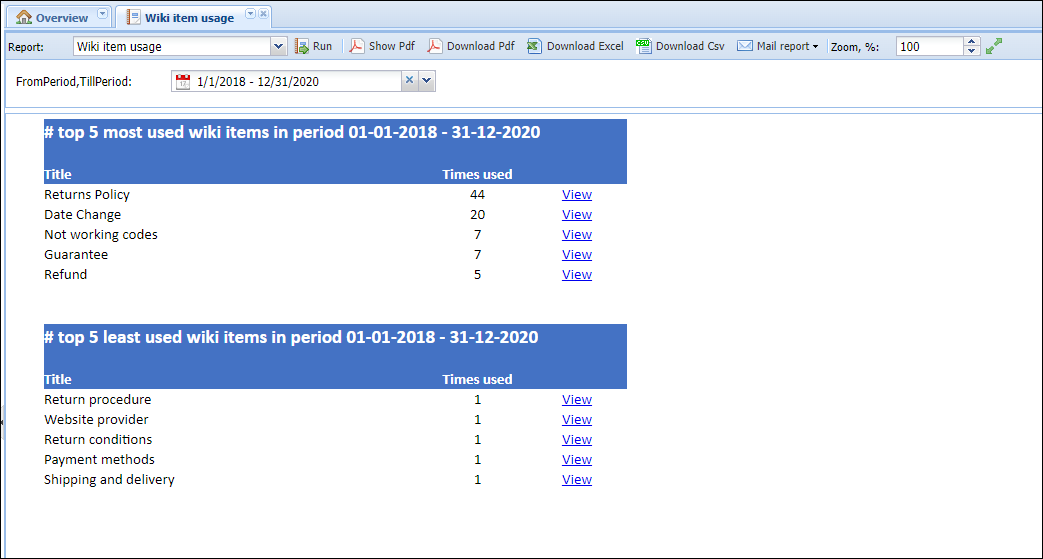
Wiki item usage
Report gives statistics about the 5 most and 5 least used wiki articles. By default, the current month period is pre-selected.
Report parameters:
- Time period
Reports on inventory, purchasing, and communication with suppliers
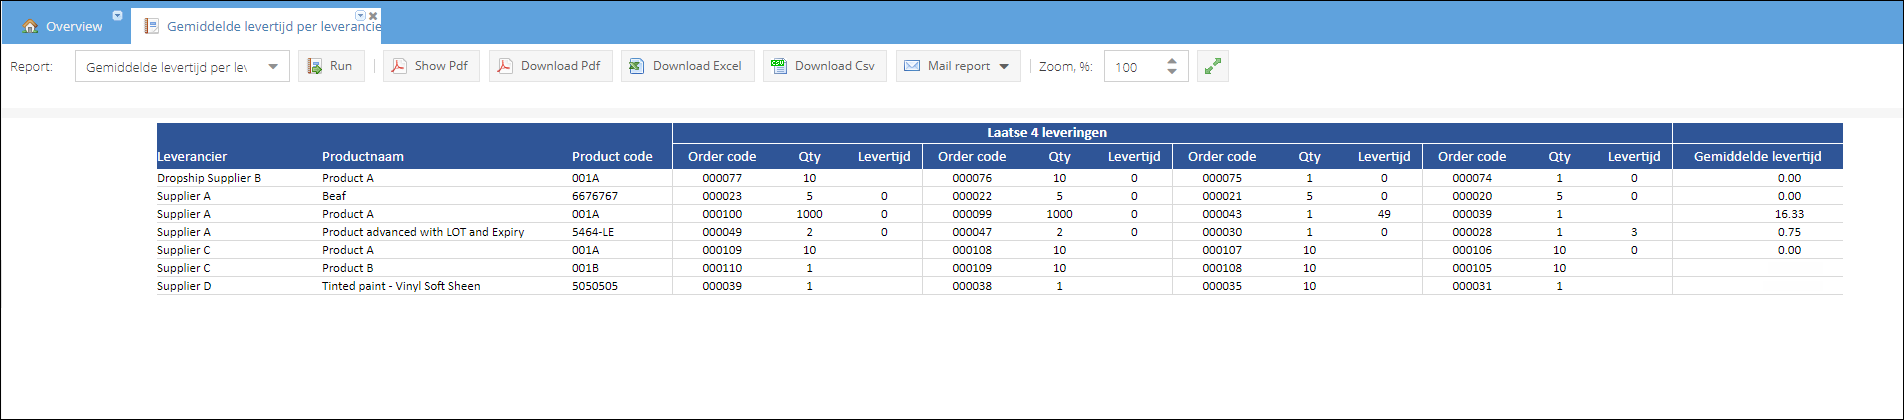
Gemiddelde levertijd per leverancier - Average delivery time per supplier
Average delivery time per supplier provides statistics for the last 4 deliveries fulfilled by the supplier.
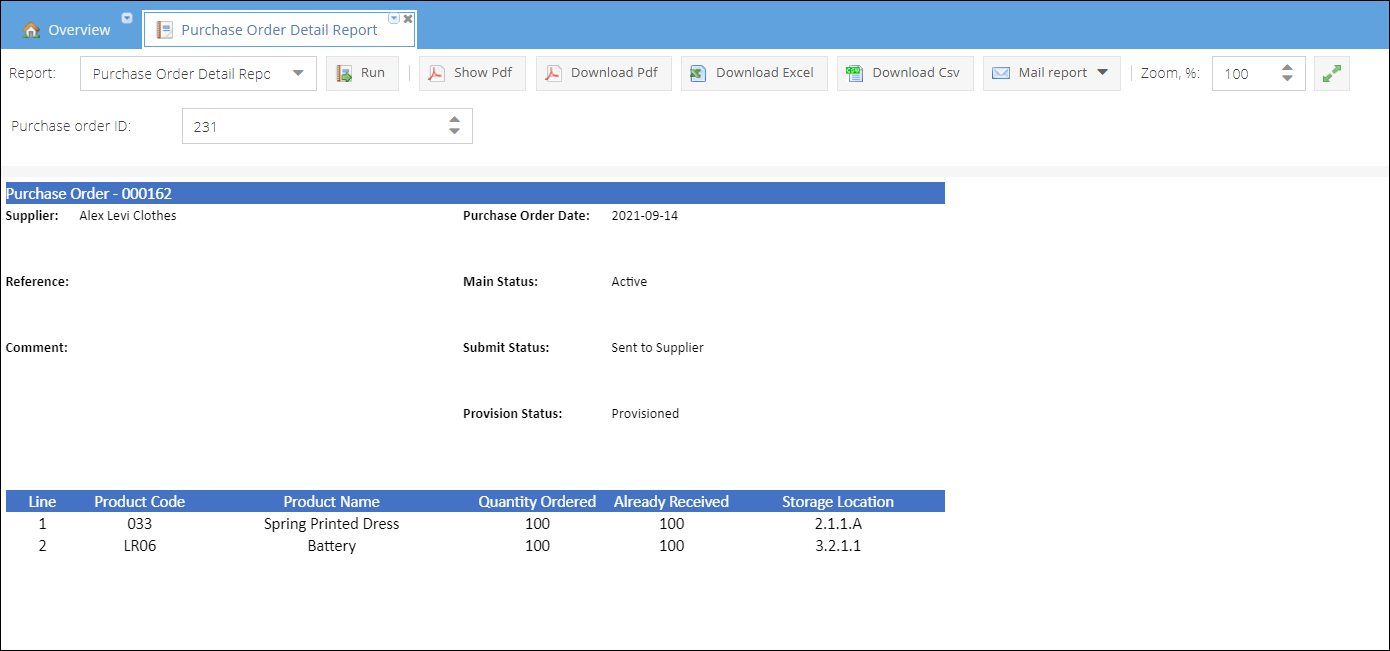
Purchase order detail report
The Purchase order detail report provides an opportunity to easily get an overview of a certain purchase order. Including all the details about the provisioned quantities, and yet to be received products.
Report parameters:
- Purchase order ID
Please note, that report searches not by purchase order code, but by ID. The last could be retrieved by API, or from purchase order grid ID column in UI.
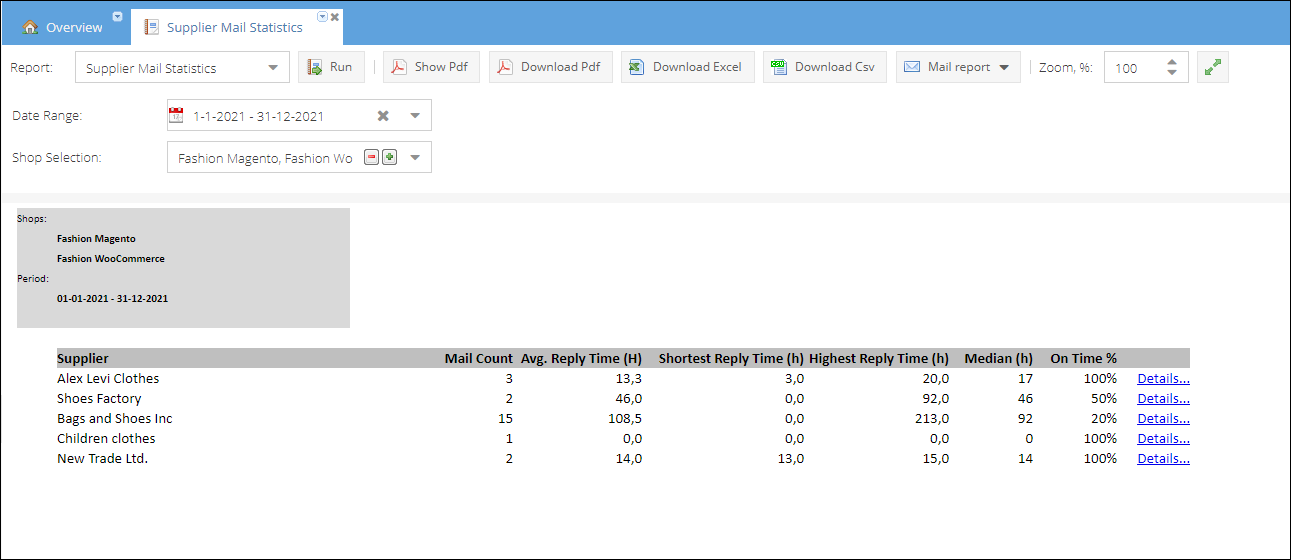
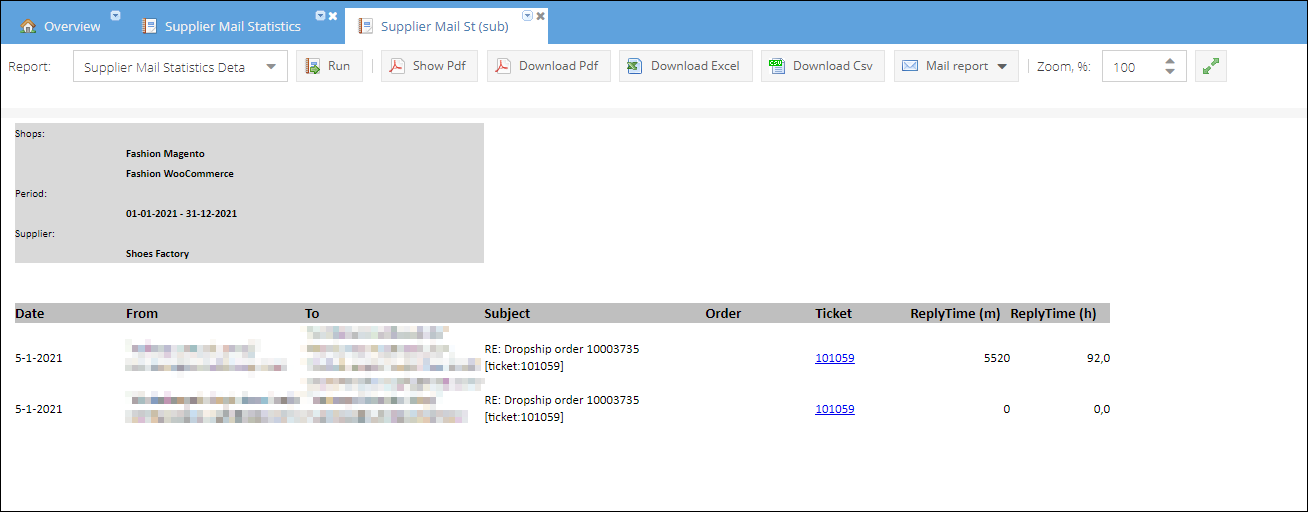
Supplier mail statistics
Provides information about the average response time to supplier emails. It also queries in-depth details of mails received and tickets assigned in a separate sub-report. Report parameters:
- Date range
- Shop
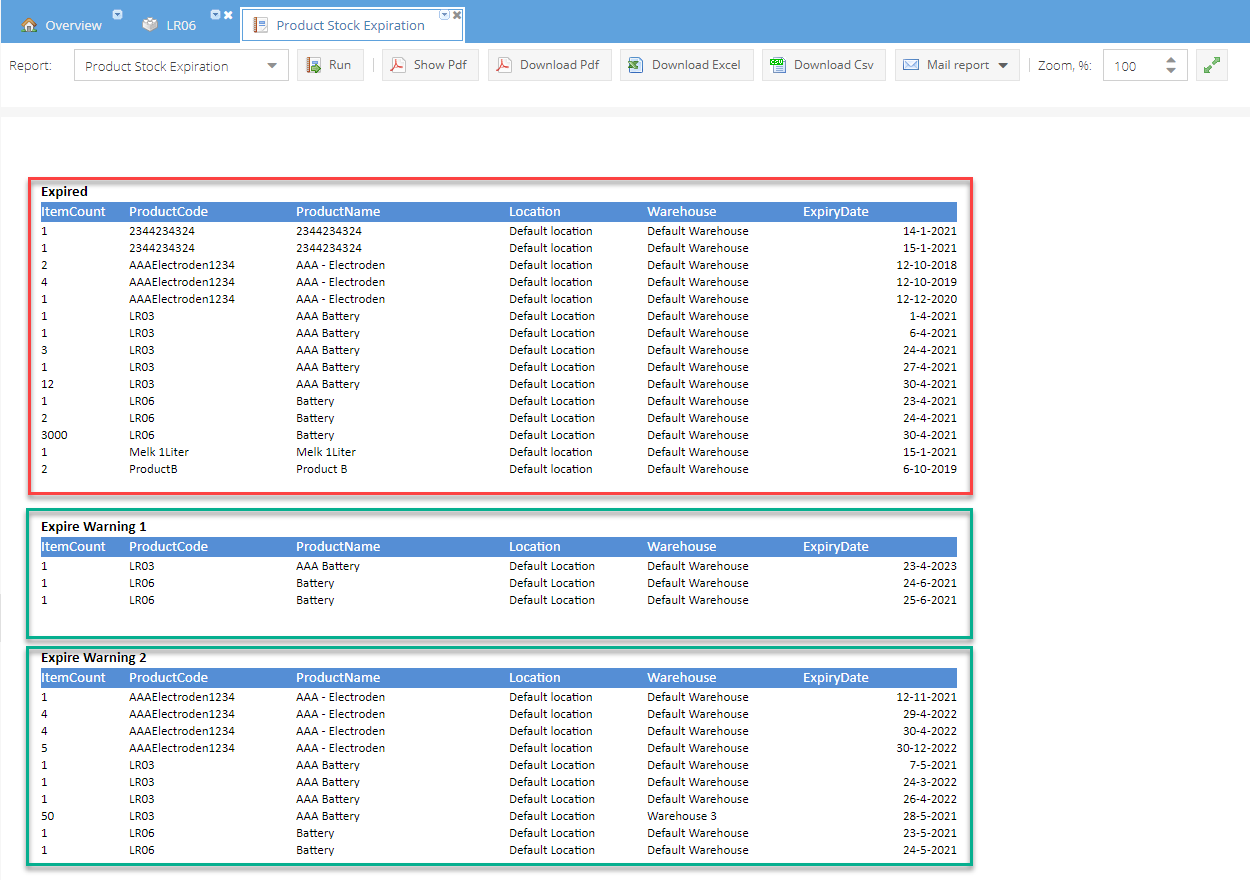
Product stock expiration report
The Product stock expiration report is a part of the [Adwanced warehouse]/User-Guide/09-Purchasing/advanced-warehouse.md functionality. Products are grouped based on the time left before expiry.
Configuration reports
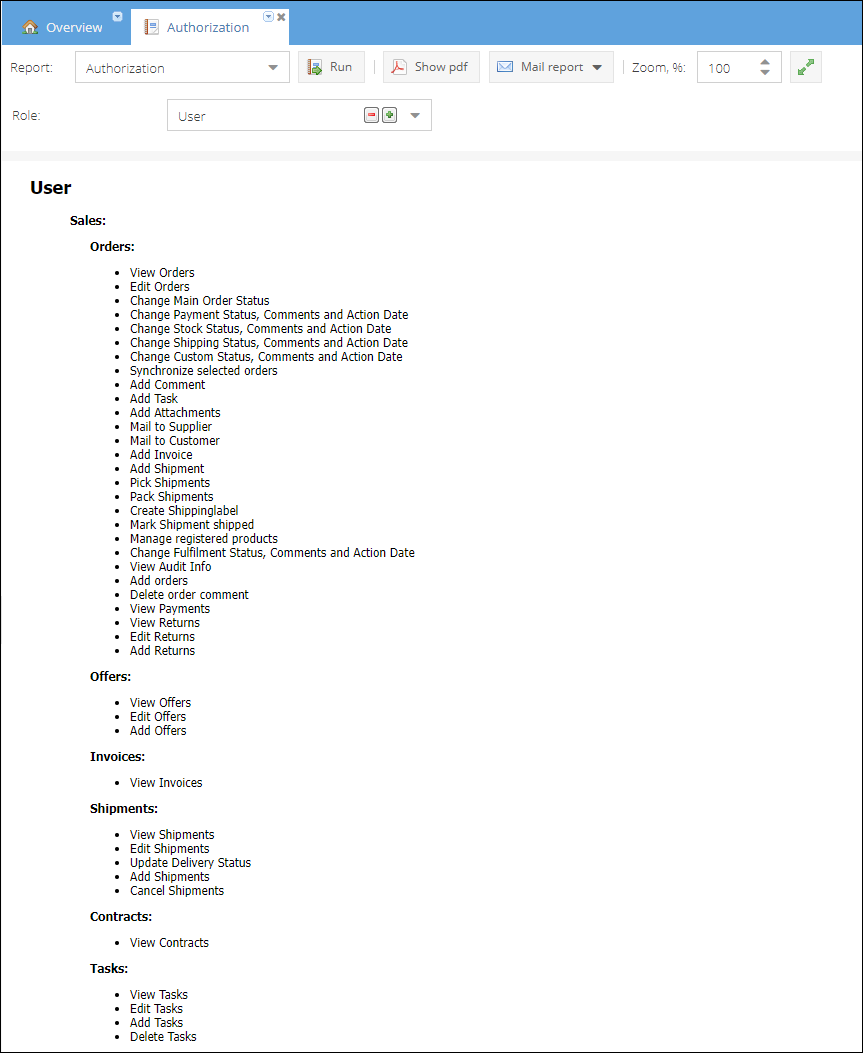
Authorization report
The report gives an overview of the existing roles and permissions. The list contains all the fine grained permissions granted to the role. Please check Understanding Employee Roles and Permissions for more information.
For advanced reporting capabilities, see our dedicated Report Developer Resources